The other day, I was looking at the S&P 500 version of the Advance-Decline (A-D) Line, which tracks the cumulative daily advances minus declines for the SPX components. We can see that it has been confirming the market's advance for months, with a steady stream of rising bottoms confirming the market's advance. But we can also see that, for the last two months, the Advance-Decline Volume Line has turned in a string of declining tops, which is a bearish negative divergence. This raises the question: which indicator should we believe?
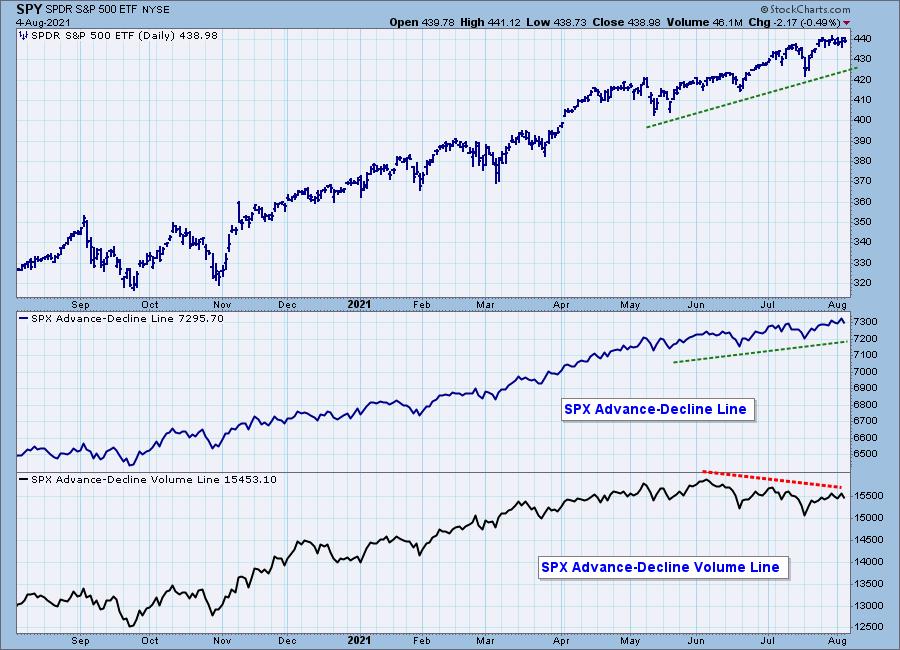
For the A-D Line, a stock will register as an advance or decline with a change of just one penny, and it will be equally weighted against a stock that changes by 100 pennies. That doesn't seem fair, does it? Well, it is what it is, and the A-D Line is a venerable indicator that it gives us a useful peek into the market's internals. We just have to be aware of its limitations.
That's all well and good, but why is the A-D Volume Line diverging from price? The reason is that it takes the same basic advance or decline and weights it by the amount of the day's volume. This doesn't address the disparity of differences in the amount of price change between stocks, but it does apply a useful adjustment to the problem. Because of this, I think the A-D Volume Line is the more useful of the two, because it is telling us that, in spite of rising prices, volume is fading and the advance is losing support.

This leads me to a third breadth indicator, the Silver Cross Index (SCI), which was invented here, so we think it's pretty good. Most people have heard of the Golden Cross, which is when the 50-day moving average crosses up through the 200-day moving average. The Golden Cross implies a very positive long-term outlook for the stock or market index. We have always viewed the upside crossover of the 20EMA versus the 50EMA, a Silver Cross, as a positive omen for the intermediate-term, and so we developed the SCI, which expresses the percentage of stocks in the SPX that have a Silver Cross.
The chart below shows the SCI along with its sister, the Golden Cross Index (GCI), which is the same as the SCI except it tracks the percentage of upside 50/200EMA crossovers in the SPX. But back to the SCI, which gives us a more accurate, more enduring assessment of market breadth, and it is a superior breadth indicator. When the 20EMA is above the 50EMA, it tells us that the stock has been persistently bullish over an extended period. When the SCI drops, we know with certainty that negative 20/50EMA crossovers are taking place, and that participation is fading. The result is that any market advance is being undermined.
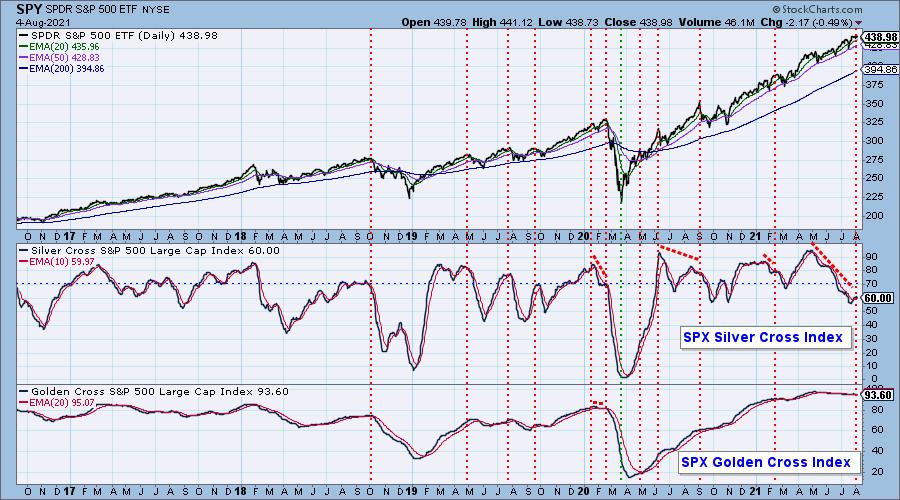
Since May, the SCI has been dropping steadily and by a lot. Yes, we can see steeper and deeper SCI declines, but none that have happened while the market was moving up. At this point, only about sixty percent of SPX stocks are participating in the market advance. This can happen because the larger-cap stocks are holding the index aloft, but it is a less desirable condition, carrying considerable danger.
At DecisionPoint.com, we have SCIs and GCIs on 22 market and sector indexes.
Technical Analysis is a windsock, not a crystal ball.
--Carl Swenlin

Click here to register in advance for the recurring free DecisionPoint Trading Room! Recordings are available!
(c) Copyright 2021 DecisionPoint.com
Helpful DecisionPoint Links:
DecisionPoint Alert Chart List
DecisionPoint Golden Cross/Silver Cross Index Chart List
DecisionPoint Sector Chart List
Price Momentum Oscillator (PMO)
Swenlin Trading Oscillators (STO-B and STO-V)
DecisionPoint is not a registered investment advisor. Investment and trading decisions are solely your responsibility. DecisionPoint newsletters, blogs or website materials should NOT be interpreted as a recommendation or solicitation to buy or sell any security or to take any specific action.


