The auto stocks have been in the news for the allure of everyone driving electric vehicles. A year ago, I started writing about the electric car theme and the race to lead.
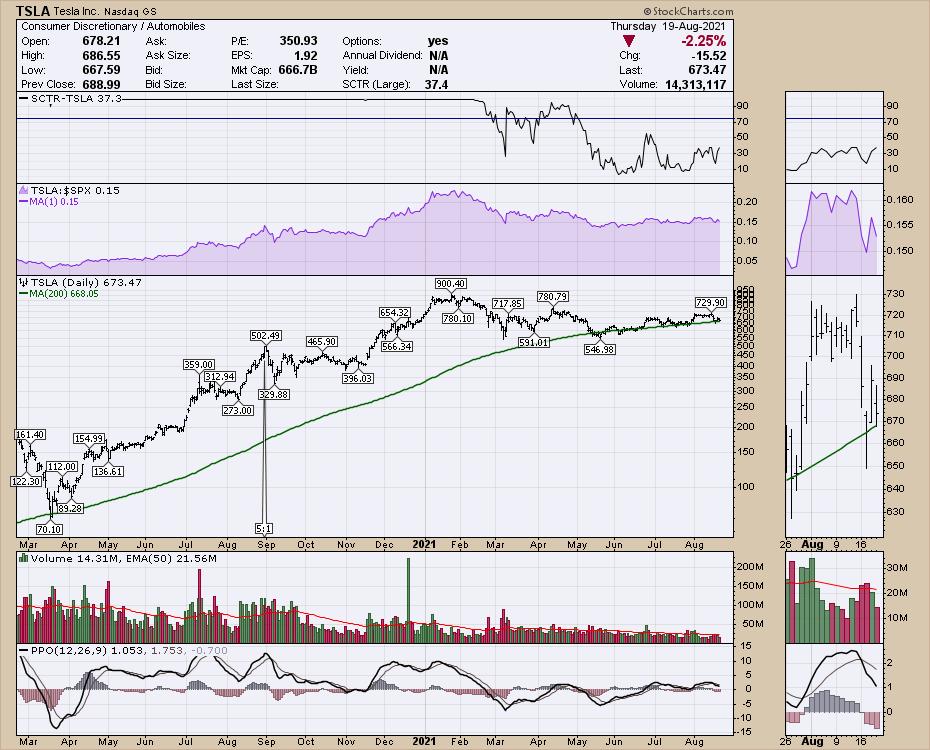
 1934 TerraplaneAfter TSLA made its mountaintop high in the spring, the primary stock in the industry group has not done much. Even the charm of Elon can't seem to warm the buy button for investors. It's a good time to review the stock. Tesla made a daunting run in 2020 and, in the first part of September, it split shares 5:1. That would put the stock at $2500 before the split and $500 after the new shares were split out. The stock cooled sideways for 2 months and hit the mountain highway again for a final assault on $900 after being added to the S&P 500, making Elon one of the richest men in the world.
But it also captured the enthusiasm of the youthful investor, the millennial investor, the ESG investor, the woke investor, the future investor and the index investor.
Anyone doubting Tesla at the top was just an idiot. 7 months after those heady days in January, the stock continues to rest on the 200 day moving average in green, roughly $200 off the all time highs. This little green line has supported the stock for four months. Why is this line so important?
For computer programmers, a simple definition for a stock in a long term uptrend is to be above a long term average. Institutions also like to own stocks above the long-term average and be more careful when the stock is below the average.
Tesla's future is still being talked about and the troop leader Elon mentioned the company is 12 individual startups all rolled into one company. What does that mean? The ever-present promise of autonomous driving software, the battery technology, the sophistication of electric motors, charging stations and home charging stations are all part of the allure keeping investors in the stock.
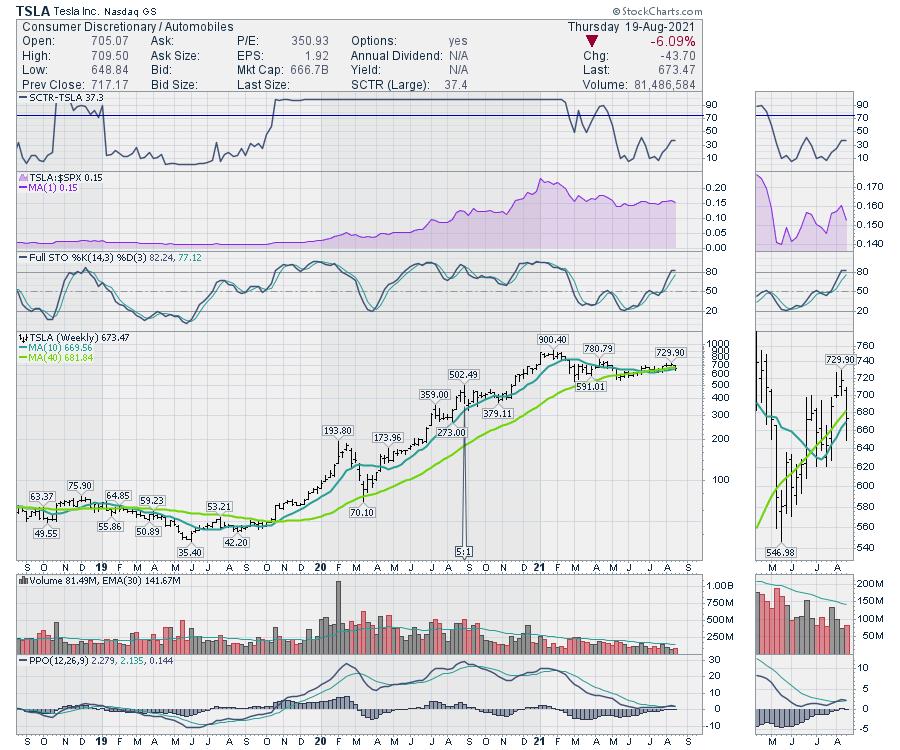
When the weekly chart is shown, the weekly momentum (PPO indicator) is near zero but turning up. I have mentioned it many times before, but strong stocks keep positive momentum. So Tesla is currently stalling, with the PPO momentum indicator staying just above zero and just above the signal line. For me, these are very important signals that must hold up.
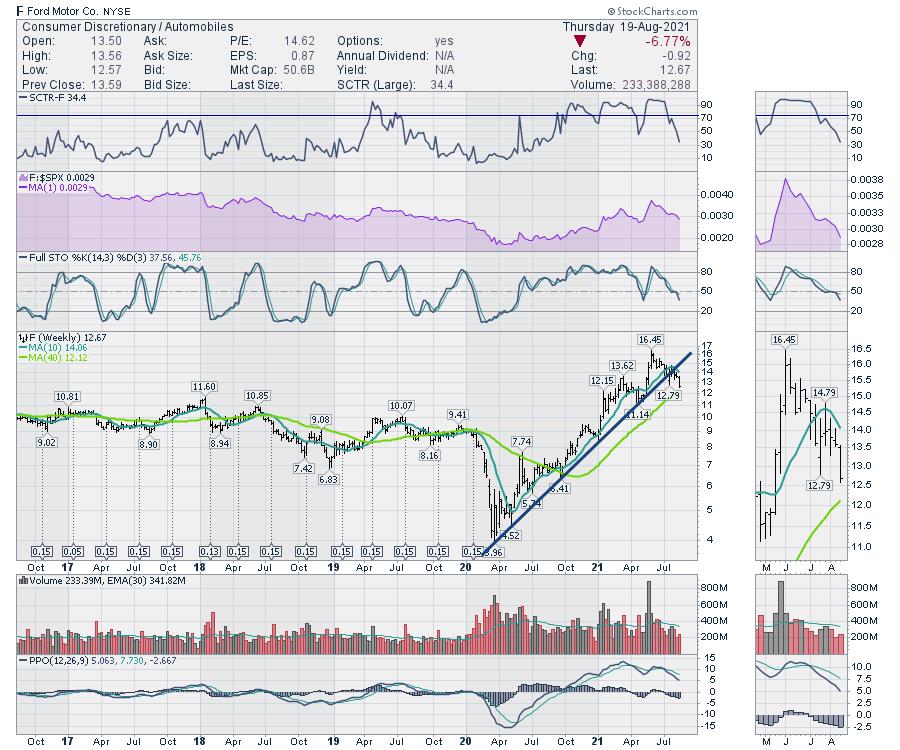
The Ford (F) brand is launching its electric pickup and my Twitter feed shows me the same ad over and over. If anyone can mainstream the truck business with electric power supply, it should be the #1 truck brand. But investors are seeing these stocks focusing on electric starting to wane. Ford is breaking the steep uptrend of the last year and is now trying to find support on the green long term moving average. In this case, it is the 40-week moving average, which is roughly equal to the 200-day (40 weeks x 5 days = 200 days). As both stocks have shed 6% this week with a day of trading left, it's a good place to make sure these electric stocks hold up. Ford's PPO momentum is dropping hard. It's even got the Cramer effect on its side, but it is not holding up.
For me, the stocks are at an important inflection point. In my Cleantech newsletter to clients each week, I look for opportunities to invest in the area. Recently, some of the names like BMW, Toyota and Honda were perking up. But this week's swoon seems to be changing all that.
All that to say, as an investor, don't be caught on the hype of the future. The Terraplane company back in 1934 was losing $21 million a year trying to compete with Ford, Dodge, Packard, Cadillac and others. There were many investors that lost everything betting on the future. While Tesla looks like the winner, at one point Ford was 80% of the automobiles worldwide.
As part of my newsletter subscription service, each week investors are kept abreast of the technical view of the wider industries related to the Cleantech theme. If that information interests you at all as just one part of my technical analysis, there is currently an August promotion where you can get 40% off the annual rate by going to gregschnell.com/explore with a two week free trial.
Good trading,
Greg Schnell, CMT, MFTA
Senior Technical Analyst, StockCharts.com
Author, Stock Charts For Dummies
Want to stay on top of the market's latest intermarket signals?
– Follow @SchnellInvestor on Twitter
– Connect with Greg on LinkedIn
– Subscribe to The Canadian Technician
– Email at info@gregschnell.com


