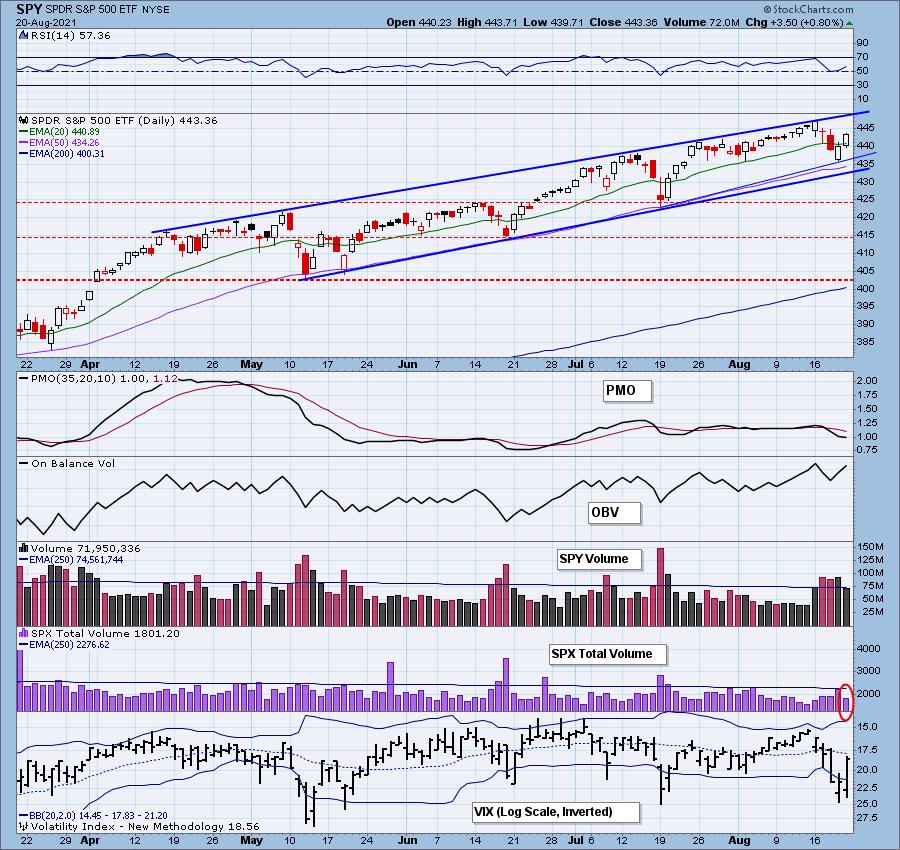
Today, we have a possible "upside exhaustion climax." We didn't get confirmation of the climax because Total Volume was so low today. This is a problem. Today was options expiration -- we should have seen more volume. Additionally, it was a strong rally day and Total Volume wasn't behind that either.
Yes, the VIX did spike higher on our inverted scale after puncturing the lower Bollinger Band, which generally leads to an upside reversal. However, you could say that, over the last two days, we got that reversal. The VIX remains below its EMA. The market typically shows weakness when the VIX is below its EMA.
Some of you may ask, "What happened to Wednesday's Downside Initiation Climax?"
Two thoughts:
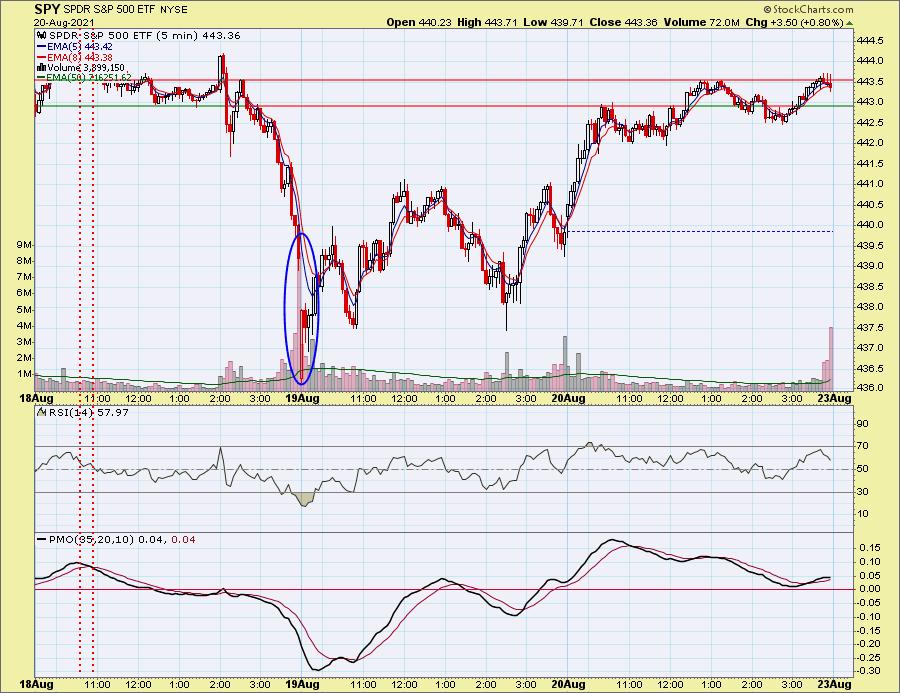
1) We saw a gap down on the open Thursday that could be assigned to the downside climax.
Below is the 5-minute candlestick showing the gap down that capped off the waterfall decline on Wednesday. That could be the conclusion of that downside initiation. Now, price is chopping around and has been followed by an "upside exhaustion climax."

Click here to register in advance for the recurring free DecisionPoint Trading Room! Recordings are available!
2) Wednesday's climax hasn't completely played out.
Today's elevated Net A-D and New Highs, combined with threshold breaks on the Volume Ratios, could be an upside exhaustion climax. Or it could simply be confirming Wednesday's downside initiation climax.
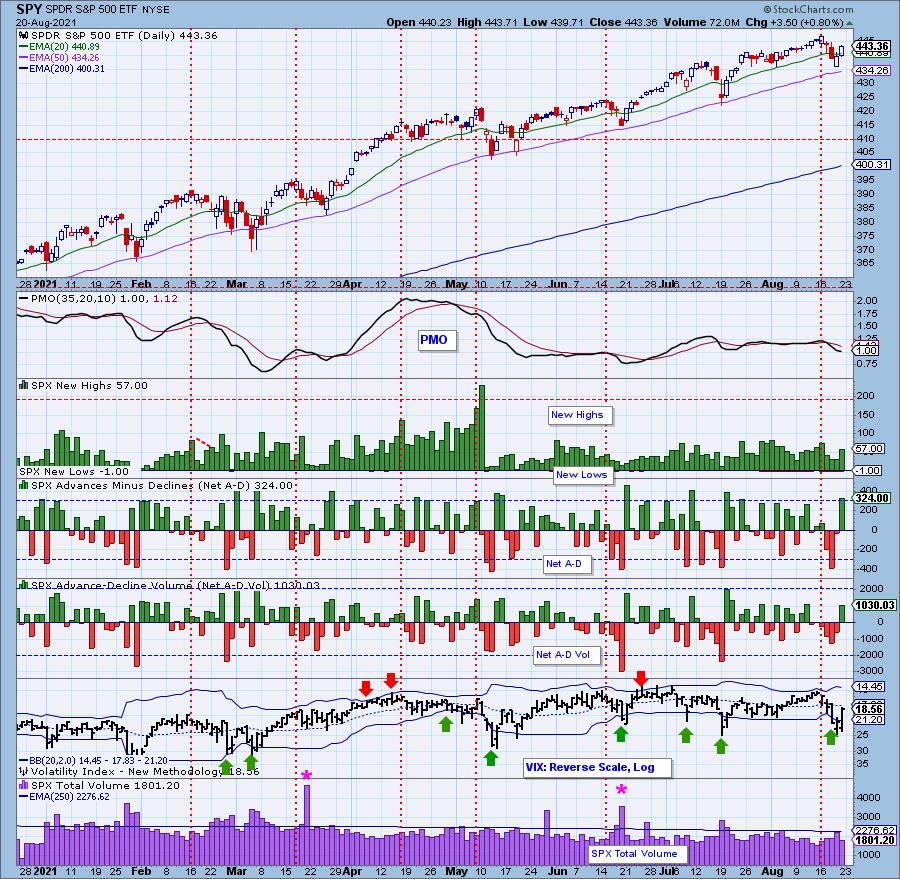
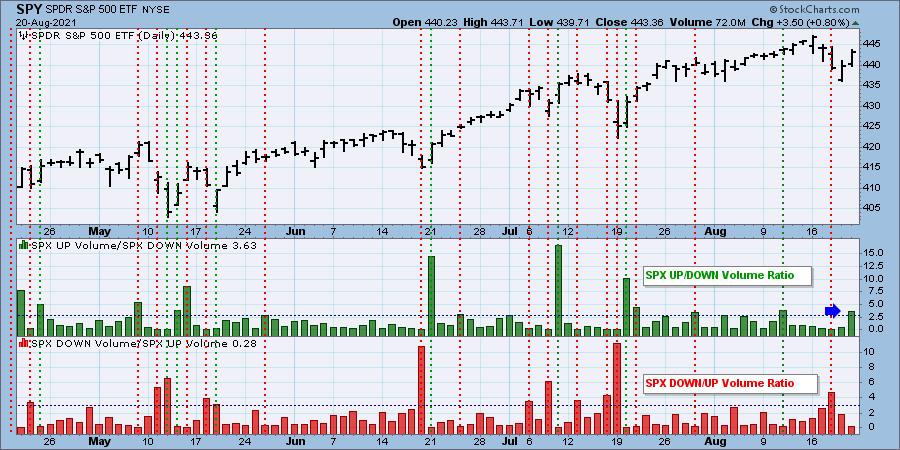
Conclusion: Whether we have a new upside exhaustion climax or we have a continuation of Wednesday's downside initiation climax, the result is the same: lower prices. We're not out of the woods yet.
Be alerted to all downside and upside climaxes by subscribing to the DP Alert. It is a must-read that you can read in less than 10 minutes. Get coverage of Bitcoin, Yields, Bonds, Dollar, Gold, Gold Miners, Crude Oil and sector rotation. It's invaluable at an incredibly low price of $35/month! Get the best technical analysis for less!
Technical Analysis is a windsock, not a crystal ball.
--Erin Swenlin
(c) Copyright 2021 DecisionPoint.com
DecisionPoint is not a registered investment advisor. Investment and trading decisions are solely your responsibility. DecisionPoint newsletters, blogs or website materials should NOT be interpreted as a recommendation or solicitation to buy or sell any security or to take any specific action.

Try us out!
Have access to our archived reports going back to 2019.
Subscribe to our "Bundle Package"
Use Coupon Code: DPTRIAL at checkout to receive one free week!
Helpful DecisionPoint Links:
DecisionPoint Alert Chart List
DecisionPoint Golden Cross/Silver Cross Index Chart List
DecisionPoint Sector Chart List
Price Momentum Oscillator (PMO)
Swenlin Trading Oscillators (STO-B and STO-V)


