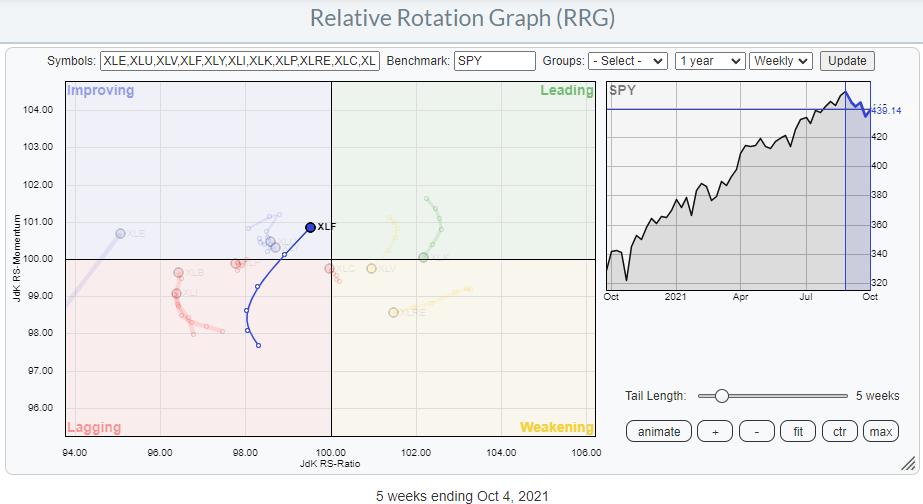
On the Relative Rotation Graph for sectors, the tail on XLF is showing one of the most promising rotations, being inside the improving sector and traveling at a strong RRG-Heading towards leading. Relative and price-technical arguments aside, I think there are two charts that support a further rotation towards and into the leading quadrant for the Financials sector.
Government Bonds
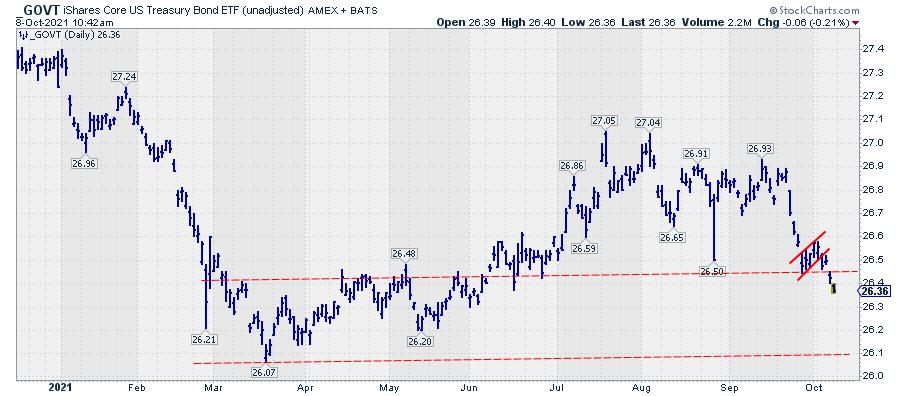
Government bonds, ETF GOVT, have just broken lower from a small consolidation pattern after the first thrust lower. The next support level to watch, imho, is around 26.10. Lower bond prices mean higher yields and higher yields are a positive thing for financials, especially banks.
Yield Curve
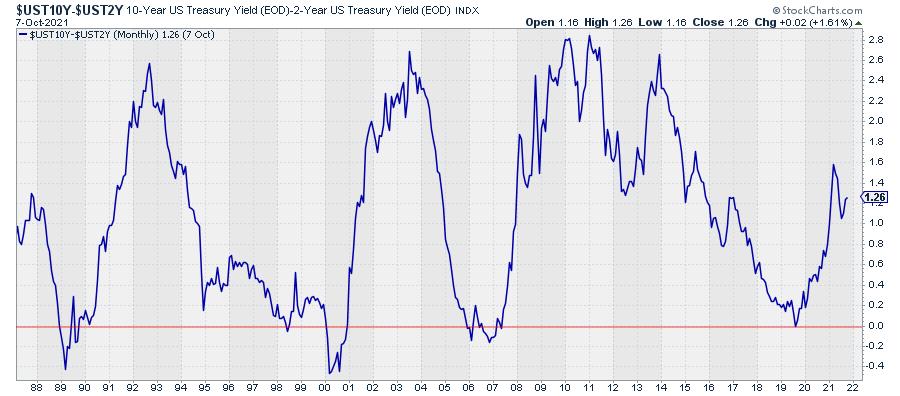
The second chart I am watching is the yield curve, essentially the difference between 10-year and 2-year yields. On the chart above, you can see how that difference "inverted" (i.e. dropped below 0) shortly in the middle of 2019. After that low, the difference started to rise sharply, which means a steepening curve. The long-dated yields are rising faster than the shorter-dated yields. This, in general, is also a positive for financials/banks.
Groups
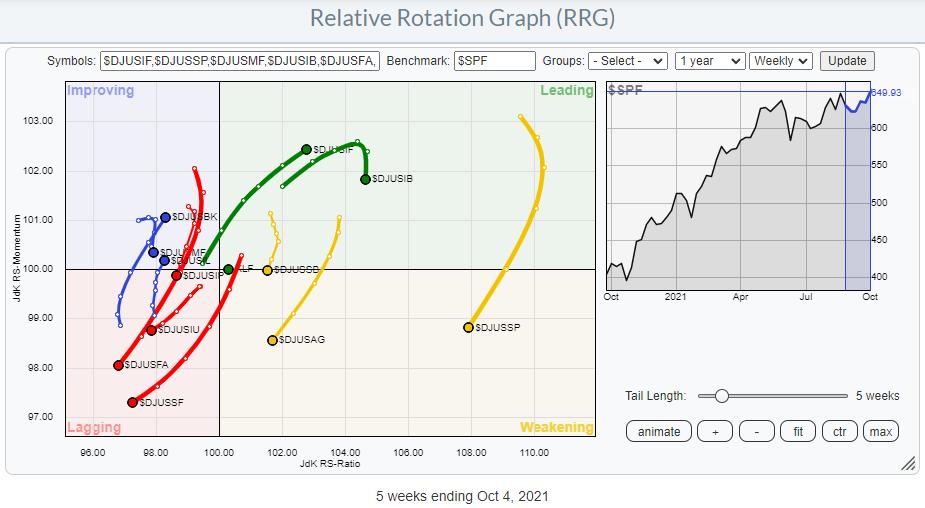
The RRG that shows the rotations for the various groups in the financials sector highlights a few interesting tails.
From a positive point of view, the eye-catchers are Full-Line Insurance, Banks and, to a lesser extent, Life Insurance. These groups are all at a strong RRG-Heading and either inside or moving towards the leading quadrant. The groups in the yellow weakening quadrant are all still fairly good from a relative point of view, but they seem to be going through a corrective phase. All groups inside the lagging quadrant are also at a negative heading and are therefore better avoided.
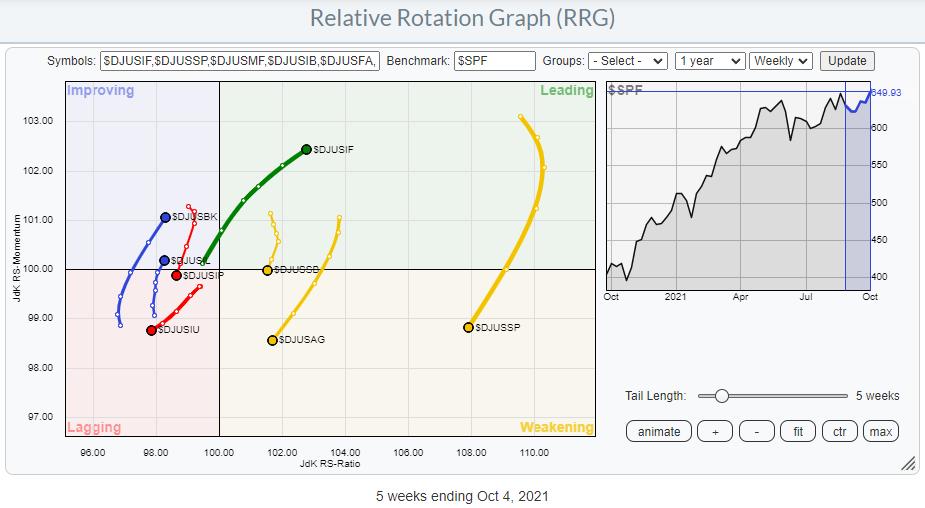
On the same RRG above, only the most meaningful tails are displayed. It's interesting to see how different the rotations for the various insurance groups are playing out.
$DJUSIF (Full Line insurance) is clearly in a strong relative uptrend, but $DJUSIP (Property and Casualty Insurance) and $DJUSIU (Reinsurance) are on an opposite trajectory. Banks, $DJUSBK, is found inside the improving quadrant, at a strong RRG-Heading and on its way to leading.
Banks
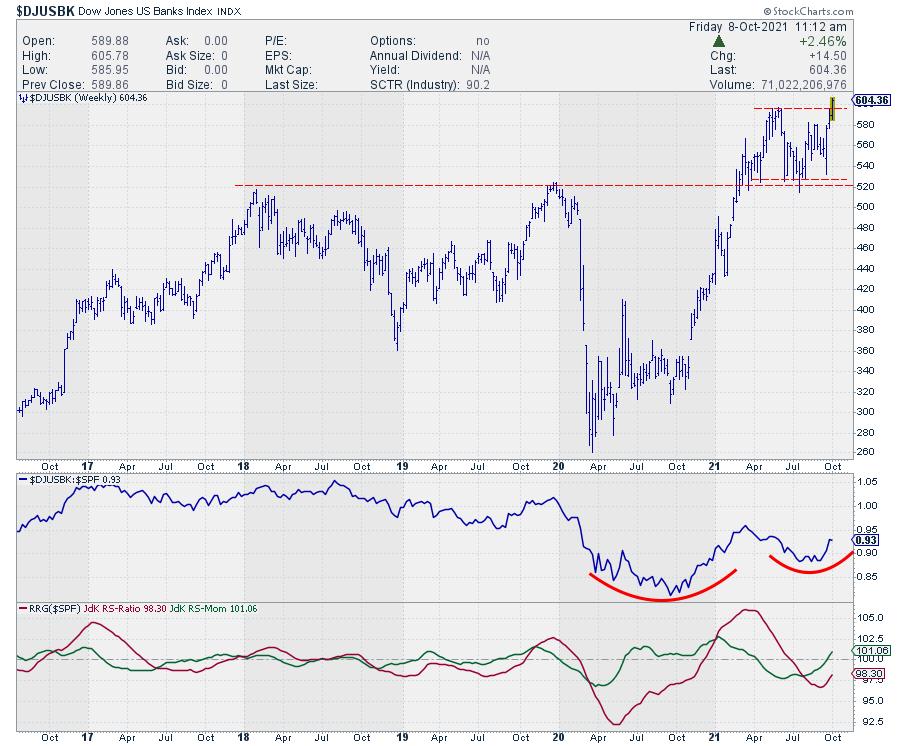
This week, the Banks index is breaking out from a consolidation phase that started after breaking above multi-year resistance earlier this year. So this is fully aligning with a strong relative rotation. As the consolidation is clearly marked by an upper and lower boundary and the upward break is looking pretty strong (half a day trading left when I am writing this article), we can peg a price target by projecting the height of the range on top of the breakout. Roughly, this comes out with $670 as the target ($600-$530=$70, $70+$600=$670).
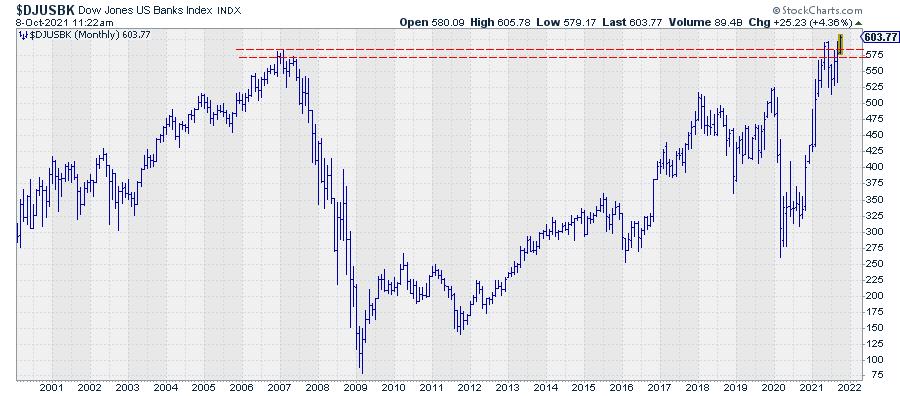
A quick check on the monthly chart learns that this break actually also means the clearing of the 2007, pre-financial crisis, top.
The added benefit of such a break is that the upward potential is, in essence, unlimited, with no overhead resistance insight, while downside risk is well protected at the breakout level ($600).
Fifth Third Bancorp
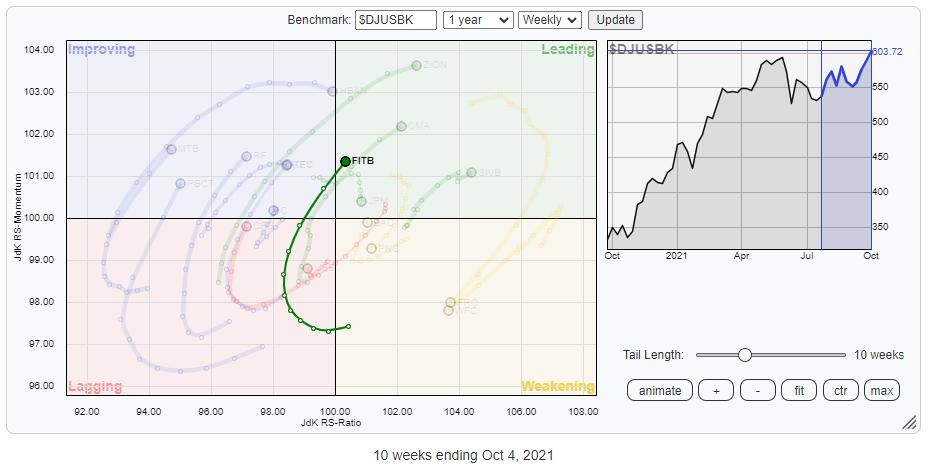
Running a Relative Rotation Graph for the banks in this index against the Group index as the benchmark shows a few interesting tails that are worth further investigation. For this occasion, I picked FITB.
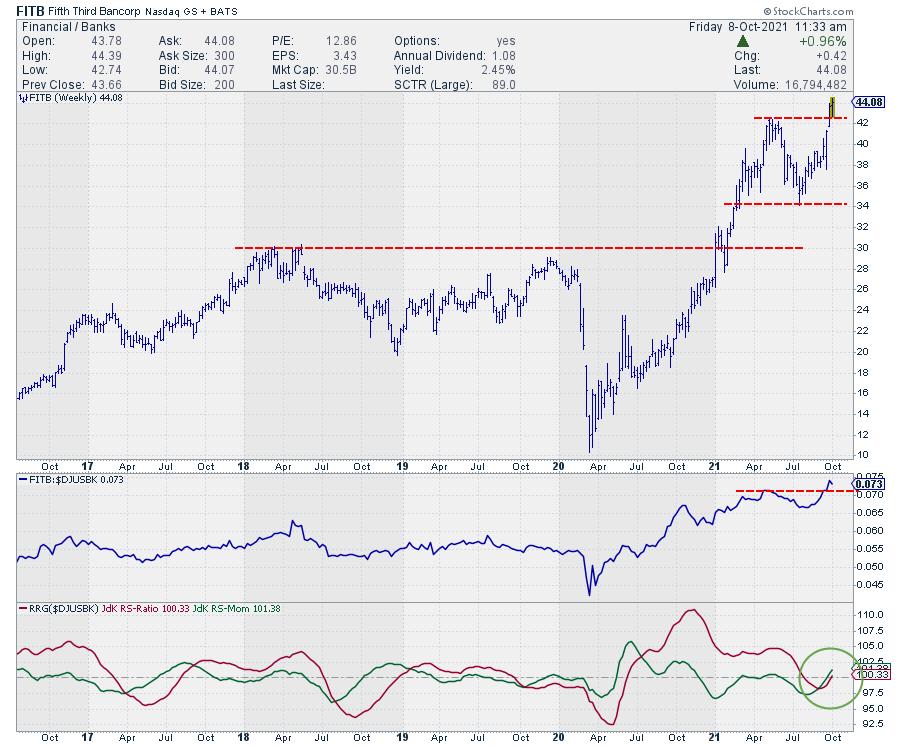
Both RS and Price are breaking to new highs, which causes both RRG lines to curl back up above the 100-level and push FITB further into the leading quadrant of an already leading group in a sector that is getting stronger!
However!!! The real message is, once again, coming from the monthly chart!
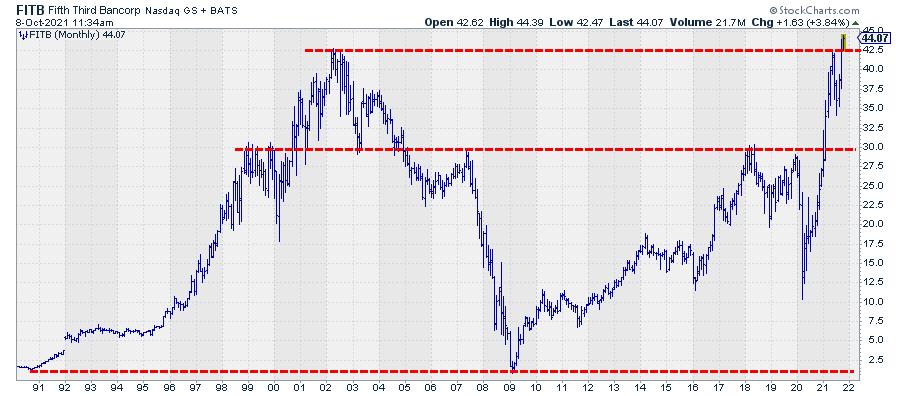
The close of the monthly bar for September was at 42.44, which was right on the overhead resistance level coming off the monthly highs from March-June 2002(!!!.... 2002, that is almost 20 years ago!!) and May 2021.
Breaking 20-year resistance.... Wow .....
One word of caution. The month of October is still young. BUT, when FITB can hold and close above roughly 42.50, all ingredients for a massive rally are lining up.
Wishing you a very good and healthy weekend. --Julius
My regular blog is the RRG Charts blog. If you would like to receive a notification when a new article is published there, "Subscribe" with your email address.
Julius de Kempenaer
Senior Technical Analyst, StockCharts.com
Creator, Relative Rotation Graphs
Founder, RRG Research
Host of: Sector Spotlight
Please find my handles for social media channels under the Bio below.
Feedback, comments or questions are welcome at Juliusdk@stockcharts.com. I cannot promise to respond to each and every message, but I will certainly read them and, where reasonably possible, use the feedback and comments or answer questions.
To discuss RRG with me on S.C.A.N., tag me using the handle Julius_RRG.
RRG, Relative Rotation Graphs, JdK RS-Ratio, and JdK RS-Momentum are registered trademarks of RRG Research.


