 Chartists looking to trade in the direction of the bigger trend have two options. First, take trend signals and act when the trend turns up. Once an uptrend is underway, chartists must then rely on pullbacks, short-term oversold conditions and bullish continuation patterns to hitch a ride. Today's article will put these two options into action using the DB Agriculture ETF (DBA).
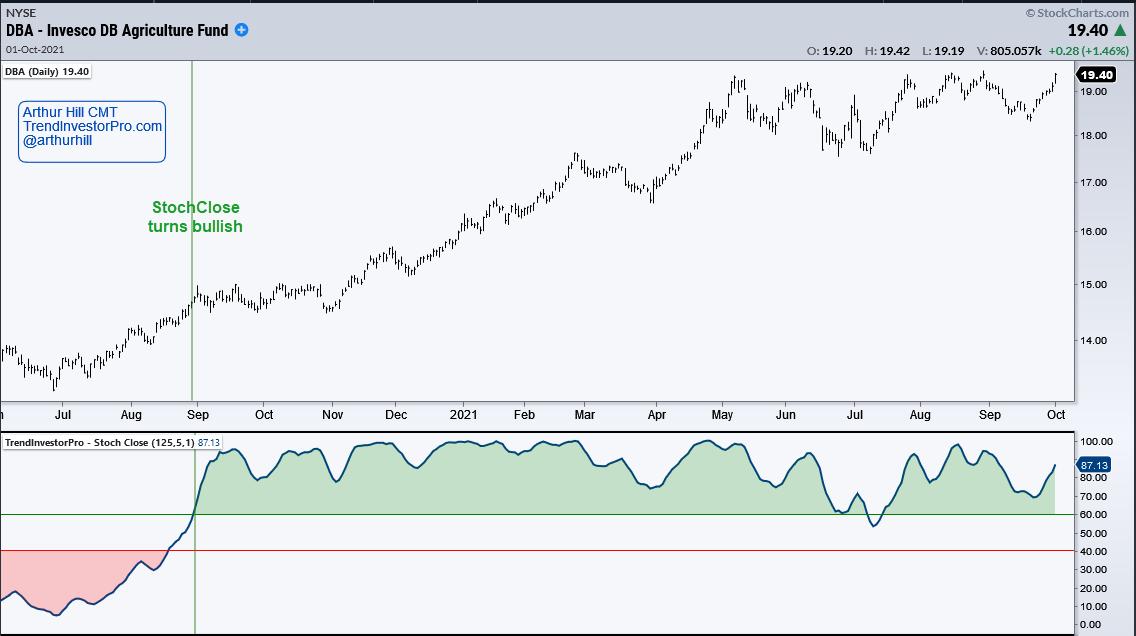
First and foremost, the long-term trend is up for the DB Agriculture ETF (DBA). Price is near a 52-week high and StochClose (125,5) has been bullish since August 31st (green vertical line). This trend-following indicator turns bullish (green) with a move above 60 and remains bullish until a downtrend signals with a move below 40 (turns red). This indicator is part of the TIP Indicator Edge Plugin for StockCharts ACP.
In addition to the uptrend, there is a large bullish continuation pattern and a small wedge breakout within this pattern. First, the green arcs mark the cup and handle of a cup-with-handle pattern, which is a bullish continuation pattern popularized by William O'Neil of IBD. The red shading marks rim resistance and a breakout would signal a continuation of the bigger uptrend. Within the handle, we can see a small wedge and a breakout on September 23rd. This was the early jump on the bigger breakout, which I expect.
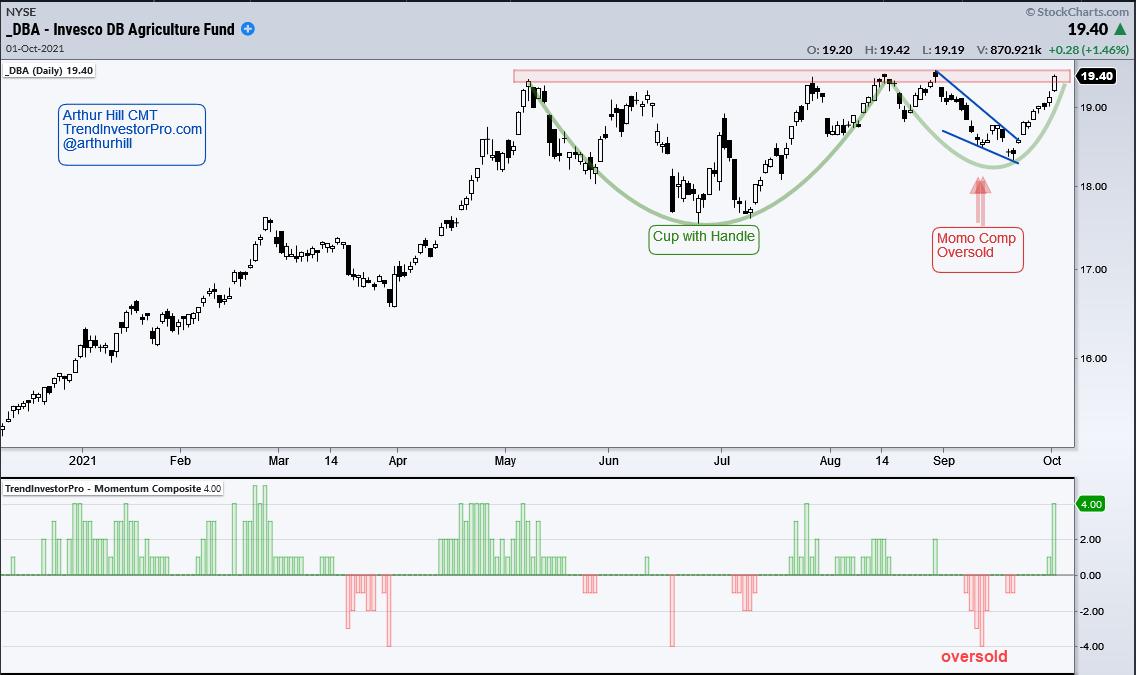
The indicator window shows the Momentum Composite, which aggregates signals in five momentum oscillators. This indicator hit -3 and -4 as the wedge formed and this denotes a short-term oversold condition. Such conditions alert traders to watch for a bullish catalyst or short-term breakout, such as the wedge breakout.
Looking for more uptrends and bullish setups within these uptrends? TrendInvestorPro specializes in trend identification and finding short-term bullish setups within the bigger uptrend. Using StochClose, the Momentum Composite, RSI and classic pattern analysis, we monitor a core ETF list with over 120 names to bring you trend signals and mean-reversion setups. Click here to take your analysis process to the next level.
*****************************
Choose a Strategy, Develop a Plan and Follow a Process
Arthur Hill, CMT
Chief Technical Strategist, TrendInvestorPro.com
Author, Define the Trend and Trade the Trend
Want to stay up to date with Arthur's latest market insights?
– Follow @ArthurHill on Twitter


