 Moving averages are classic trend-following indicators and the 200-day SMA is perhaps the most widely used long-term moving average. This article will put the 200-day to the test using the Russell 2000 ETF (IWM).
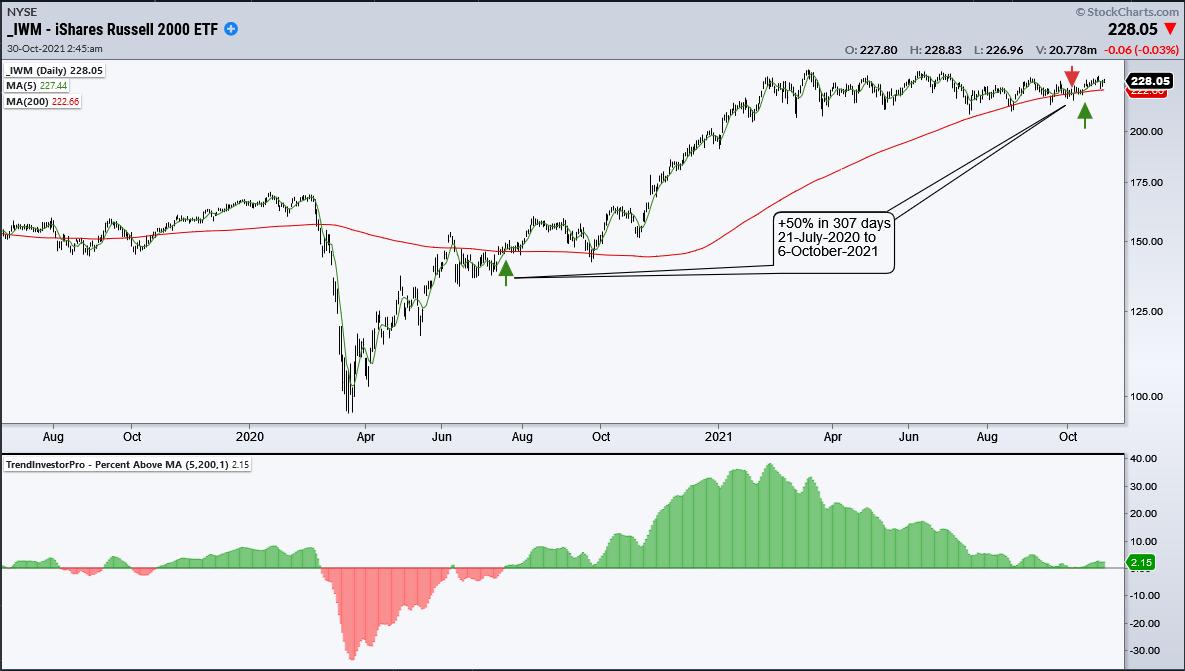
The ETF just came off its best "trend" trade ever using the 5/200 cross. However, we cannot pass judgment on an indicator or signal without looking at dozens of trades over a longer timeframe. IWM can indeed produce some big trends, but it is also prone to periods of whipsaw.
Here is a signal example. The chart below shows the 5-day SMA moving above the 200-day SMA on 22-July-2020 and remaining above for over a year (307 trading days). The 5-day crossed back below the 200-day earlier this month to complete the trend signal. Overall, IWM was up around 50% for the completed signal. The indicator window shows the percentage difference between the 5-day SMA and 200-day SMA in histogram format. Note that this indicator is part of the TIP indicator edge plugin for StockCharts ACP.
I will next turn to Amibroker software and test the 5/200 cross over the last twenty years (1-Nov-2001 to 29-Oct-2021). The 5-day SMA crossed the 200-day 78 times during this period and there were 39 trades. 16 were winners for an average gain of 13.77% and 23 were losers for an average loss of 4.18%. Thus, just 41% of the signals resulted in a winning trade, which is actually normal for a trend-following signal. This is a long-only test and the system was invested 70% of the time. This means 30% of the time the 5-day SMA was below the 200-day SMA. All told, the system generated a 4.85% Compound Annual Return (without dividends). This is ok, but not that great. For reference, SPY generated a 6.8% Compound Annual Return (sans dividends) using the 5/200 cross during this same period with 13 winners and 14 losers. SPY is clearly more "trendy" than IWM.
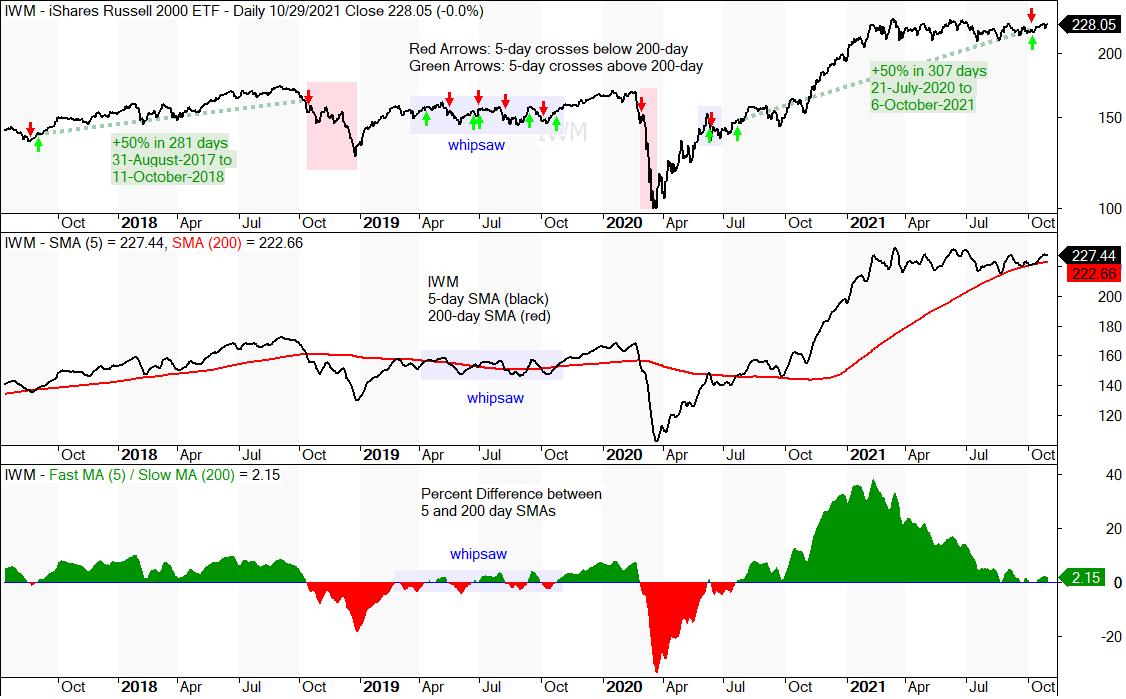
The chart below highlights the trades from summer 2017 until October 2021. The top window shows the buy/sell signals with the green/red arrows. The green dashed lines show two really good trends, the red zones show sell signals that would have avoided sharp declines and the blue shading shows the whipsaws (losing trades). With 59% of the trades resulting in losses, trend-follower can expect more whipsaws than big trends. However, trend-following strategies have positive expectancy because a few good trends pay for the whipsaws. Note that the 5-day SMA crossed back above the 200-day SMA on October 7th and the uptrend signal is back in play for IWM.
Interested in more trend-following? Stay tuned because I will be hosting a special on StockCharts TV on November 6th at noon ET. Details to follow in an Art's Charts post later this week. This show will cover the theory, expectations and reality of trend-following strategies. We will put different indicators to the test and show some techniques to improve performance. In the meantime, check out TrendInvestorPro.com for the latest trend signals, bullish continuation setups and the state of the stock market.
Click here to take your analysis to the next level!
----------------------------------------------------------
Choose a Strategy, Develop a Plan and Follow a Process
Arthur Hill, CMT
Chief Technical Strategist, TrendInvestorPro.com
Author, Define the Trend and Trade the Trend
Want to stay up to date with Arthur's latest market insights?
– Follow @ArthurHill on Twitter


