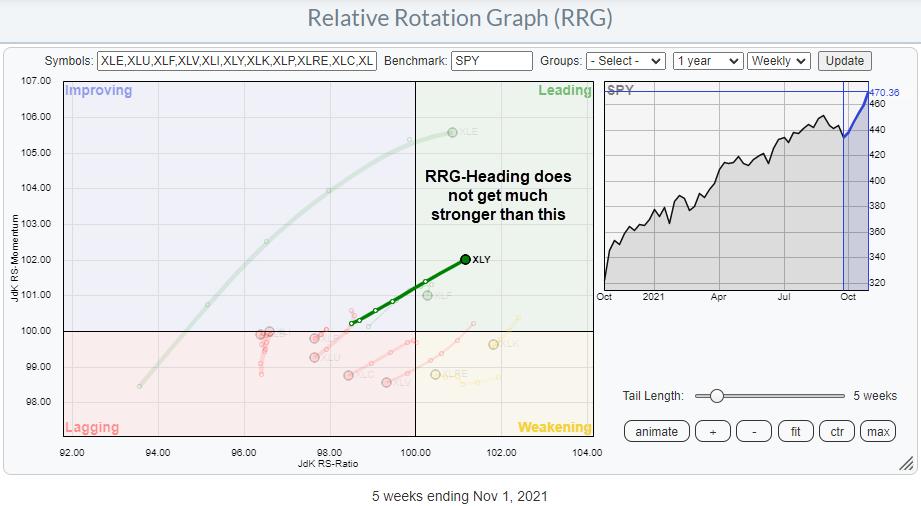
One of the (if not THE) most promising tails on the Relative Rotation Graph for US sectors is on XLY, the Consumer Discretionary sector. Over the last five weeks, the tail on XLY shows an almost straight line into the leading quadrant while gaining on both axes. Things do not get much stronger than this.
Many Groups Inside the Discretionary Sector
However, the Consumer Discretionary sector is very diversified and, therefore, has a lot of different groups. The RRG below shows the rotations for all these groups.
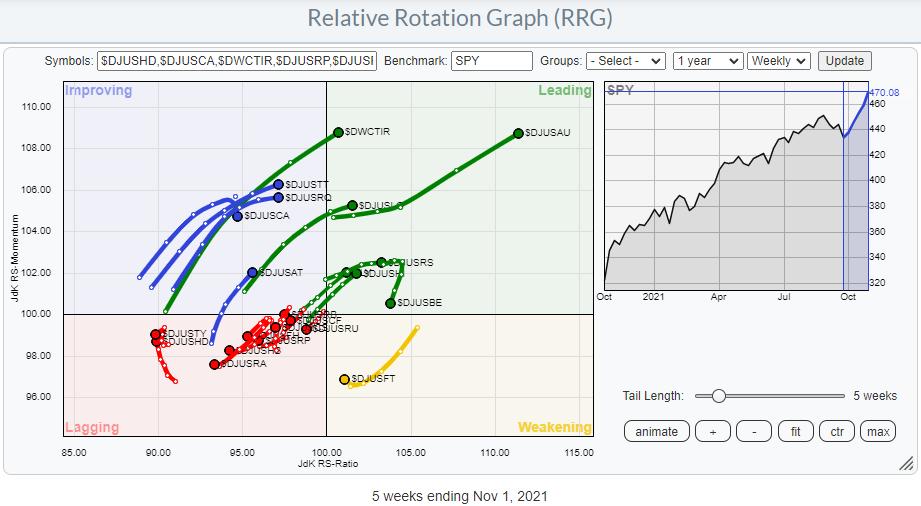
As you can see, the relative trends for these groups inside XLY, using SPY as the benchmark, are quite spread out over the canvas of the RRG. The cluster of groups with red tails inside the lagging quadrant are better avoided, as they are in a relative downtrend vs. the S&P 500 while the sector is in a relative uptrend. A double negative, therefore.
Inside leading and lagging, a few interesting tails are popping up. The same universe on an RRG with XLY as the benchmark gives a more detailed picture. Here, we compare all the groups against the sector index as well as each other, which gives the following image.
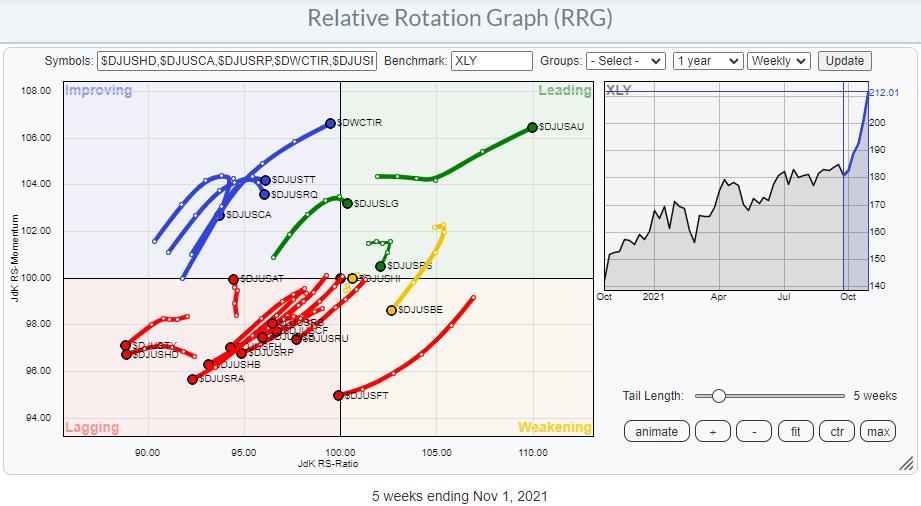
As you can see, the split between the weak tails inside the lagging quadrant and the rest of the graph has now become even more pronounced. The groups that I want to zoom in on for this article are Automobiles (obviously ;) ), Tires and Auto Parts.
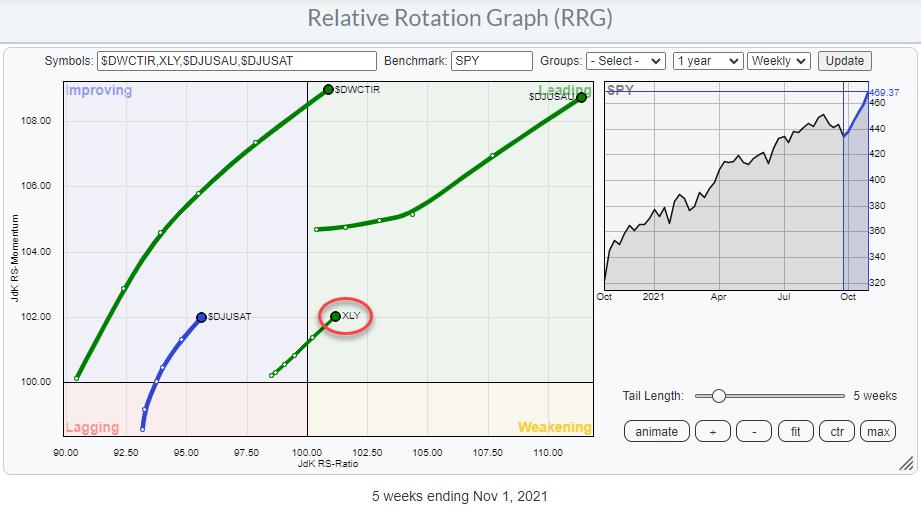
The RRG below highlights these three groups against SPY and has XLY on the canvas as a secondary benchmark.
Automobiles
The strong rotation for Automobiles is clearly visible. It is tempting to attribute that all to TSLA, but is it true? In order to find out, we can plot all automobiles on an RRG.
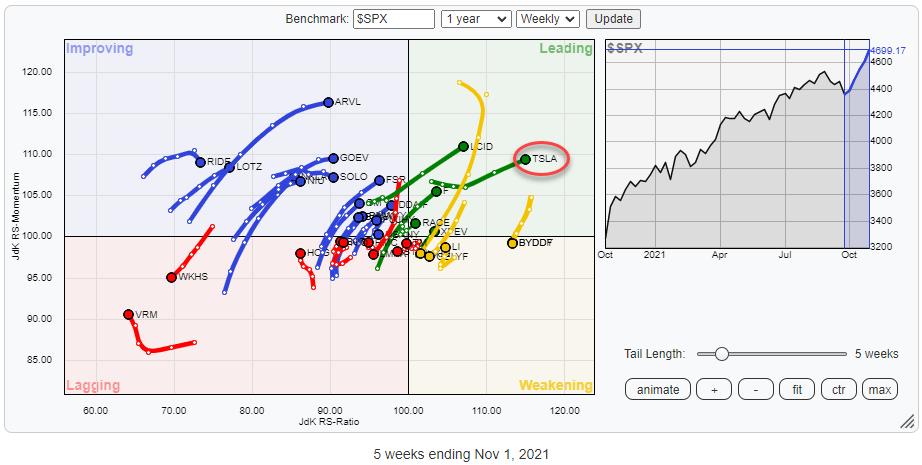 The RRG above shows all automobile stocks against the S&P 500 and, clearly, TSLA stands out, but, as you can see, there are a few more tails that are showing interesting rotations. In particular, LuCID and Ford are showing strong tails at a good RRG-Heading.
I am going to pass on TSLA for the time being, as I feel the recent steep rise has made the risk/reward for new entries unattractive.
Tires
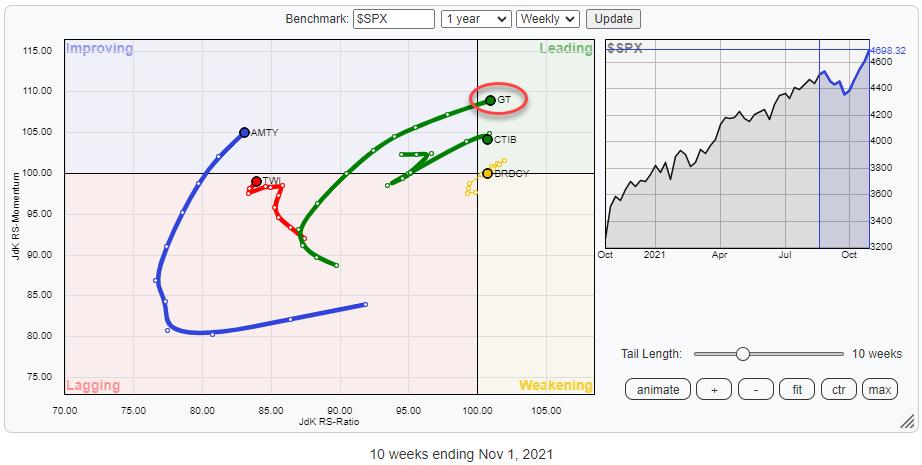
The Tires group also shows a strong rotation, but this is really only a handful of stocks, with GT being the dominant name by a mile. Nevertheless, the rotation for GT, dragging the group along with it, is strong and looks promising.
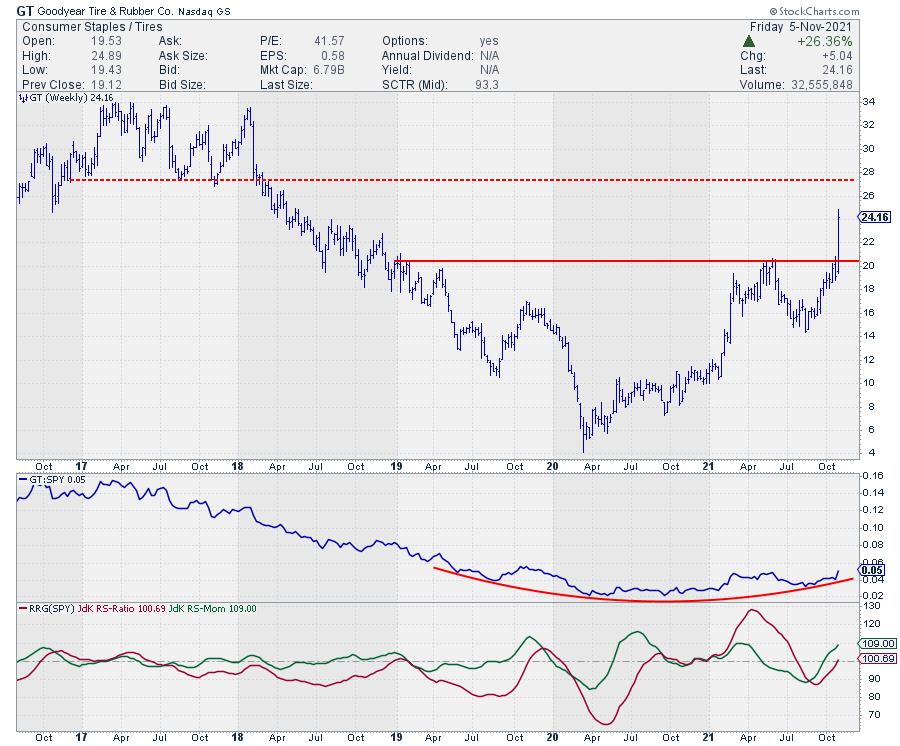
The upward break on the weekly chart is a strong sign in and of itself, but especially in combination with the long-based turnaround in relative strength that can be seen in the raw RS chart.
LT overhead resistance is coming in around $35. Once that gives way, we may see some exploding tires. ;)
Auto Parts
The third group on an interesting trajectory is the Auto Parts group. It is still inside the improving quadrant, but at a strong RRG-Heading and a steady improvement over the last weeks.
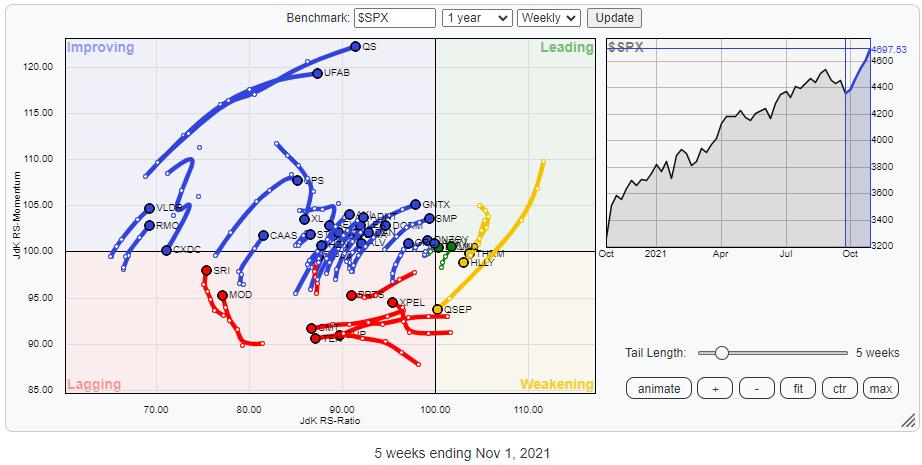
Plotting all stocks in the auto parts group against $SPX gives the RRG above. As expected, the concentration is inside the improving quadrant, with plenty of stocks traveling at a strong RRG-Heading. A few names that pop up are LKQ, QS and VC.
Check out my recent episode of Your Daily Five below for a few interesting stock picks from these groups.
11/2 Your Daily Five : Tesla Isn't The Only Car (Parts) Maker Doing Well
#StaySafe and have a great weekend.
My regular blog is the RRG Charts blog. If you would like to receive a notification when a new article is published there, "Subscribe" with your email address.
Julius de Kempenaer
Senior Technical Analyst, StockCharts.com
Creator, Relative Rotation Graphs
Founder, RRG Research
Host of: Sector Spotlight
Please find my handles for social media channels under the Bio below.
Feedback, comments or questions are welcome at Juliusdk@stockcharts.com. I cannot promise to respond to each and every message, but I will certainly read them and, where reasonably possible, use the feedback and comments or answer questions.
To discuss RRG with me on S.C.A.N., tag me using the handle Julius_RRG.
RRG, Relative Rotation Graphs, JdK RS-Ratio, and JdK RS-Momentum are registered trademarks of RRG Research.


