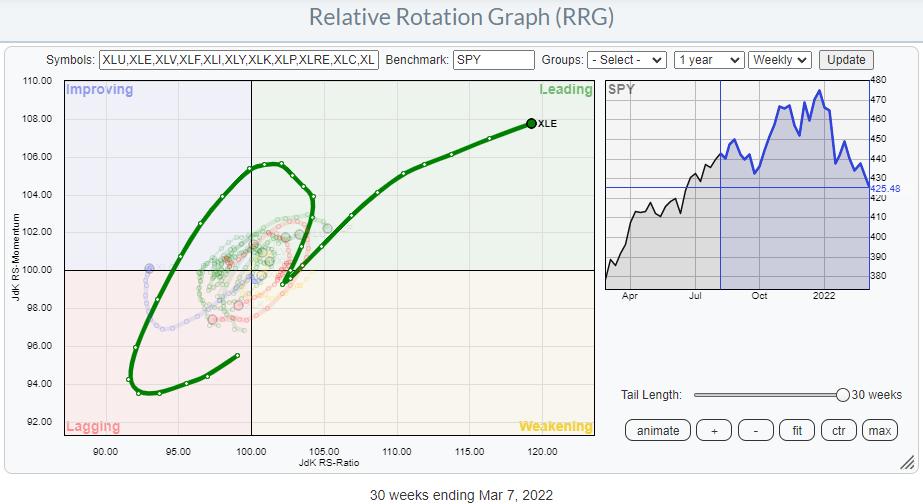
It's very clear that the Energy sector is the strongest sector inside the S&P 500 over the last several months.
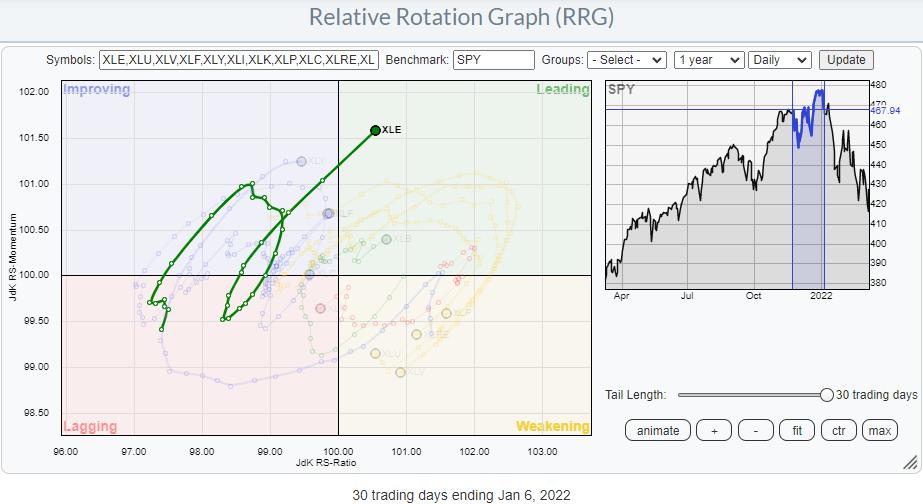
The tail on the Relative Rotation Graph above shows the rotation that the sector went through. The "hook" back up to leading from weakening at the start of the year is one of these very rapid rotations that simply went too fast to be picked up by the weekly time frame. The RRG below shows the daily rotation during that period, and the clockwise rotational shape is clearly visible.
For this article, I want to drill down into the individual stocks that make up the Energy sector, trying to find out if all are equally strong.
XLE vs $ONE
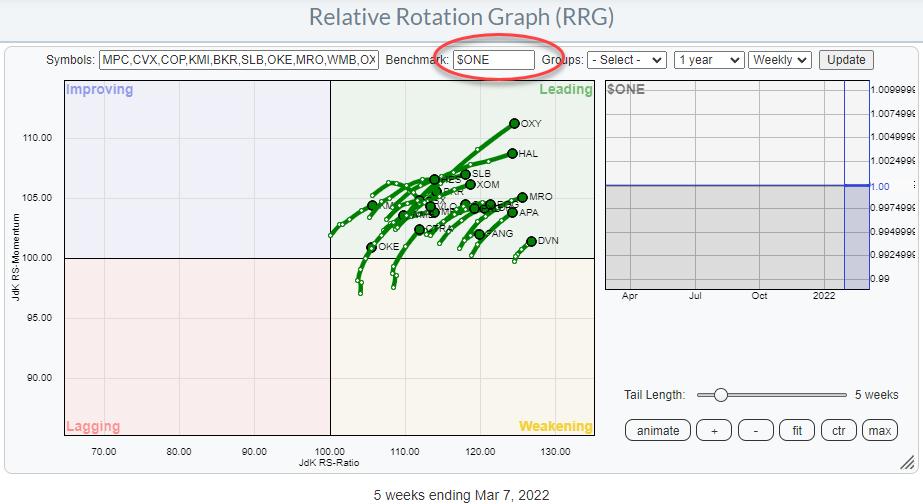
With the general market under pressure recently, I have started to use $ONE as the benchmark a bit more often, as this gives a good insight into the absolute price trends that are present inside a universe of securities.
In my 1/14 ChartWatchers article "Using RRG for Visual Inspection of Market and Sector Breadth", I explain how using $ONE as your benchmark for RRG can be used to visually inspect a sector for "breadth". The RRG above is an updated version of the graph for XLE that was used in that article. As you can see, the big picture has not changed much.
All energy stocks are still inside the leading quadrant and most are also still traveling at a strong RRG-Heading. The only difference that the keen observer will note is the level on the JdK RS-Ratio scale. In January, the mid of that cluster of tails was around 107. At the moment, the mid of the cluster is almost at 120!! That is a big move.
With the dominant direction of the tails still being within the 0-90 degree angle, the outlook for the sector remains strong.
Heavyweights Continue To Dominate
When we bring back XLE as the benchmark for the sector, things are shifting.
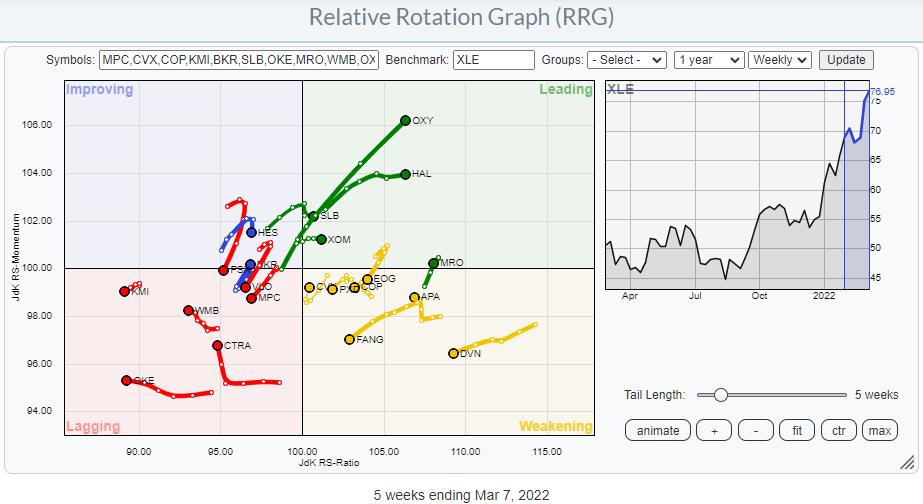
This RRG shows the XLE stocks against XLE as the benchmark. Inside the Energy sector, CVX and XOM are the dominant stocks, each accounting for more than 22% of the sector. All other stocks are below 5% market cap within the sector. When we isolate these two tails on a single RRG, we can see how they drive the sector performance.
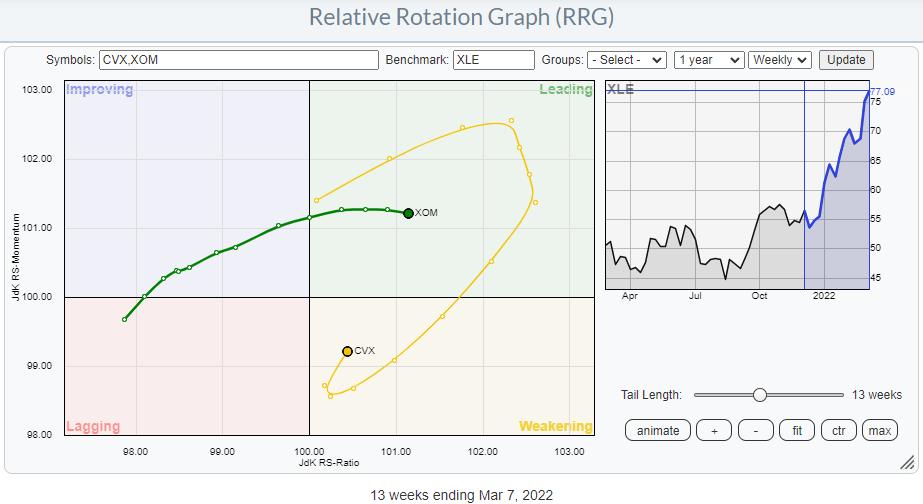
XOM is steady inside the leading quadrant and recently began slowing down a bit in terms of relative momentum, while CVX went through a very strong rotation before rolling over mid-January. This rotation is now picking up strength again on the JdK RS-Momentum axis and starting to head back towards the leading quadrant at a strong RRG-Heading.
This means that the two largest holdings inside Energy are still driving the sector. That's a good thing.
Looking for Additional Strength
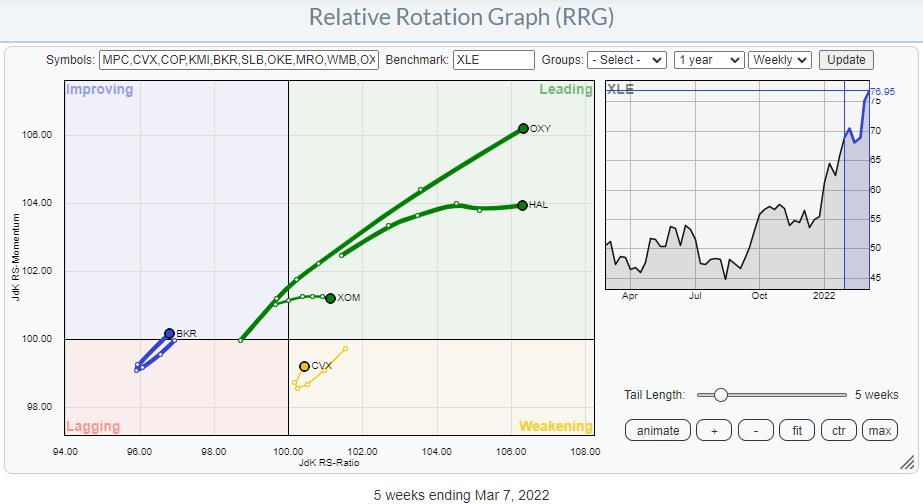
Diving deeper into the energy universe, I have highlighted the tails that are at a strong RRG-Heading. This brings back the number of tails on the canvas to four. I have added XOM to the graph because of its weight in the sector together with CVX.
From this image, OXY, HAL and BKR remain as opportunities.
The long tails on OXY and HAL suggest that they have already made a big move, which is confirmed when you bring up the individual charts. These are strong trends and there is no reason to sell right now. But getting in a new position is a different story. It feels like chasing a move at these levels.
BKR is a different story. The tail is still at the left-hand side of the graph, but is rotating from lagging into improving at the moment and starting to travel at a strong heading again. This makes it the most interesting one of the tails on the graph, as it seems to have much more potential left than the others.
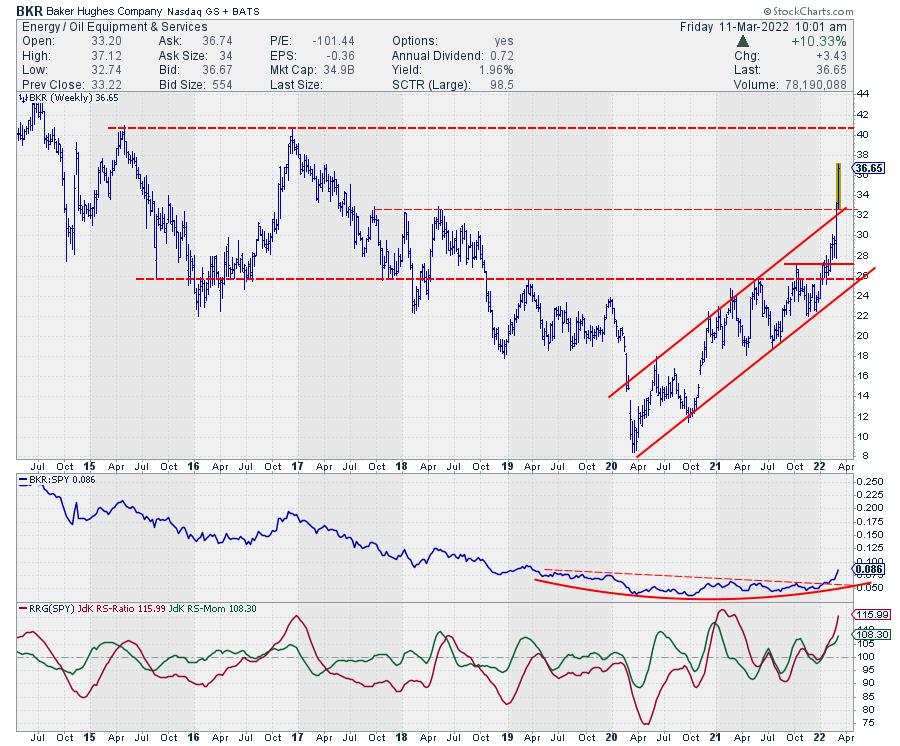
Despite the fact that BKR also already made a big move higher, there seems to be more in store, especially as its price managed to break out of its rising channel at the upper boundary, coinciding with horizontal resistance coming from 2017-2018 peaks. As long as BKR can hold above this 32 area or, even better, drop back to it and set a new low there, things are looking good.
Next resistance is expected near $40.
Have a great weekend, --Julius
My regular blog is the RRG Charts blog. If you would like to receive a notification when a new article is published there, "Subscribe" with your email address.
Julius de Kempenaer
Senior Technical Analyst, StockCharts.com
Creator, Relative Rotation Graphs
Founder, RRG Research
Host of: Sector Spotlight
Please find my handles for social media channels under the Bio below.
Feedback, comments or questions are welcome at Juliusdk@stockcharts.com. I cannot promise to respond to each and every message, but I will certainly read them and, where reasonably possible, use the feedback and comments or answer questions.
To discuss RRG with me on S.C.A.N., tag me using the handle Julius_RRG.
RRG, Relative Rotation Graphs, JdK RS-Ratio, and JdK RS-Momentum are registered trademarks of RRG Research.


