
For a bird's eye view of developments in international stock markets, I use a Relative Rotation Graph that shows the rotations for a group of international stock indexes.
The RRG below shows the weekly rotation for this group. You can find this under the pre-defined groups in the drop-down selection on the RRG page. I have added the Nasdaq and the DJ Industrials for this occasion, while I disabled the RTSI (Russian) index.
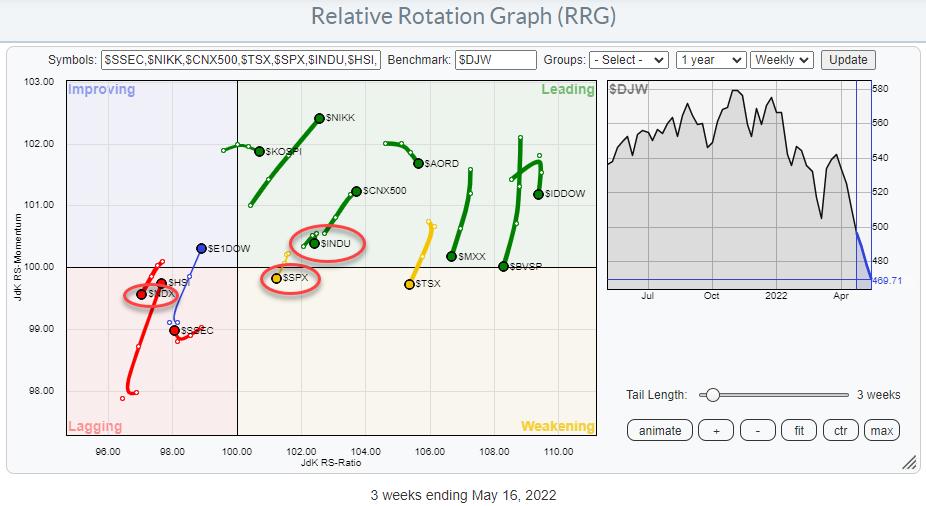
The benchmark for this chart is the Dow Jones Global Index. The US makes up a very large component of this index, which means two things:
- US market indexes will usually stay fairly close to the benchmark (center) of the chart because it is very difficult for them to deviate much
- When US markets move in one direction, by default, there has to be a group of markets that are moving in the opposite direction to offset that move. At least, that's the case when you are using a broad market index, like the DJ global index, as the benchmark.
Observations
So what do we see when we look at the RRG above?
The first thing that caught my eye was the strong rotations for Japan ($NIKK), India ($CNX500) and Europe ($E1DOW), as well as the shifted concentration of the tails to the right of the canvas. As this is an open universe, which means that not all components that are in the benchmark are plotted in the graph, this is not unusual. But, on further inspection, I noticed that all three US indexes (S&P, Nasdaq, and DJ Industrials) are heading at a negative RRG-Heading. Since they make up a large portion of the benchmark, it becomes clear(er) that the shift to the right is actually caused by the weakness in the US indexes, not necessarily from strength in those markets.
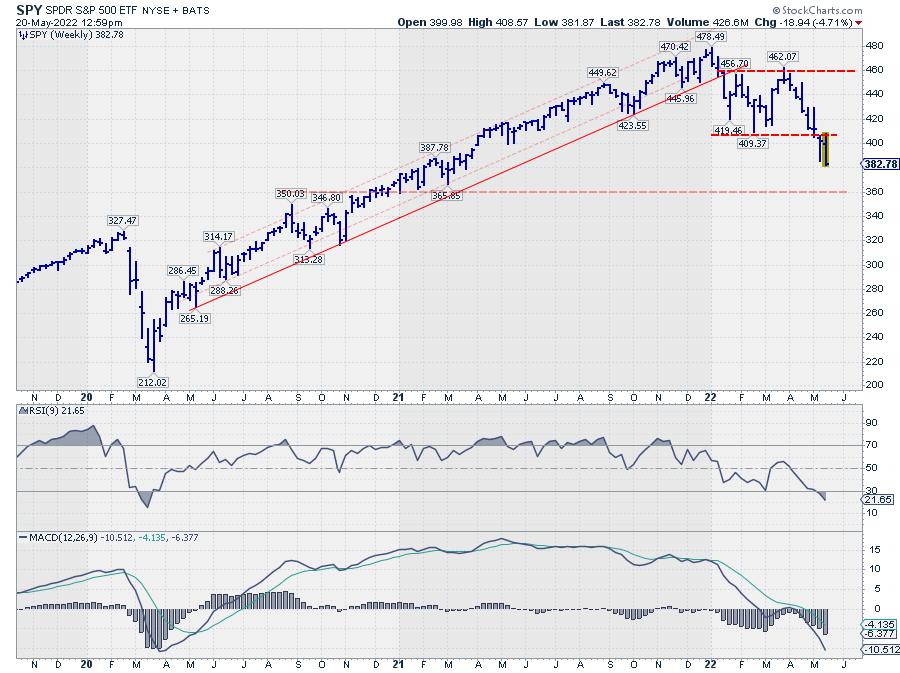
Following an intra-week rally attempt to come back to its breakout level around 410, SPY is now moving lower again. The first serious support level as I see it is now found in the 350-360 area. But, more importantly, the upside potential seems very limited and capped near 410 for the time being.
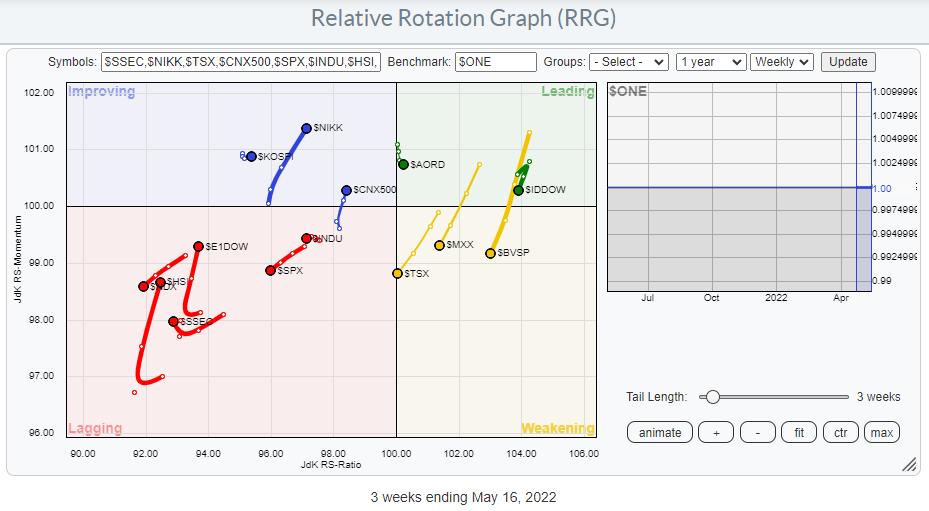
The general weakness for stocks around the world becomes even more visible when we switch to $ONE as the benchmark. All of a sudden, the concentration of tails is on the left-hand side of the graph, indicating downtrends (in this case in price), while the tails that are still on the left-hand side are at a negative heading and moving towards the lagging quadrant.
Again, also when visualized this way, the tails for Japan and India stand out, as they are pointing to the top-right. Upon inspection of their individual charts, it becomes clear that the rotation in relative terms is indeed very strong, but that the strength of the tail in absolute terms is more a recovery/pause in a trend that is predominantly moving lower.
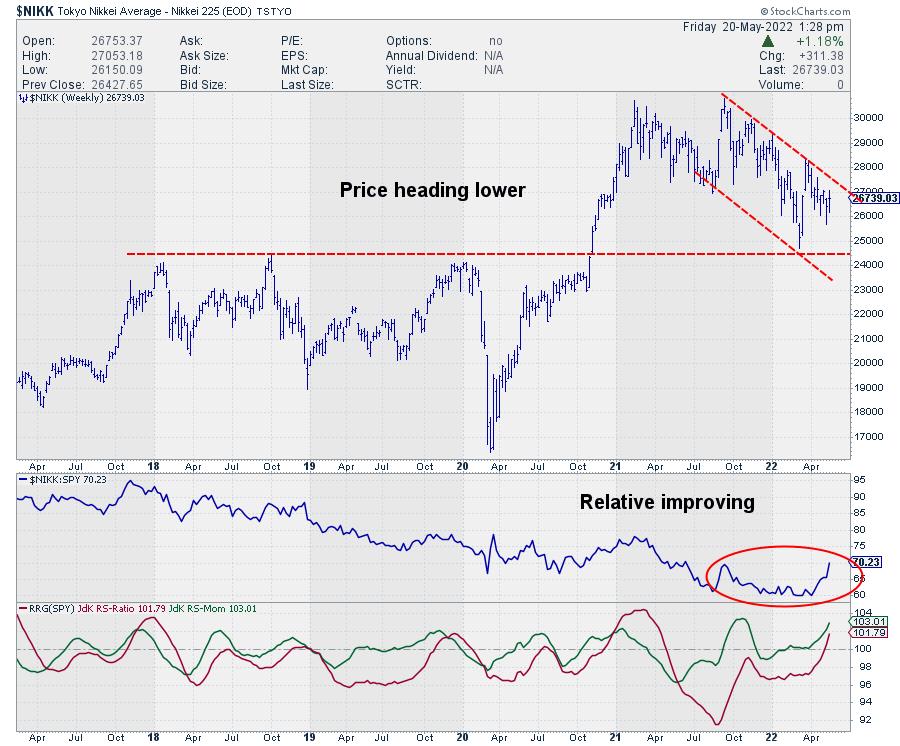
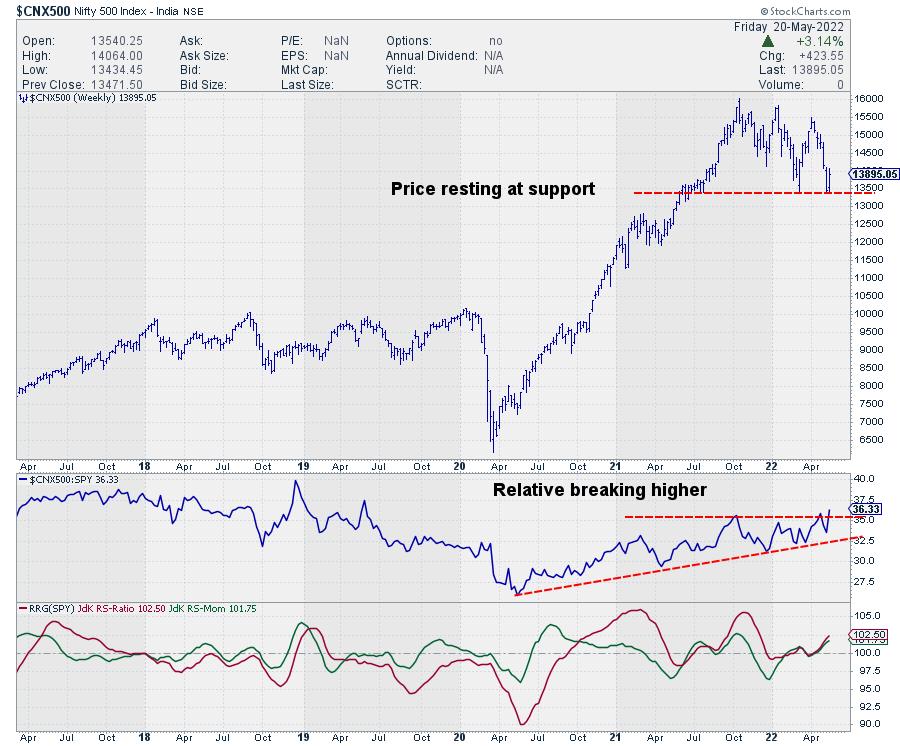
Given the strong US dollar, ETFs tracking those markets can be interesting hedges / offsets against positions in US stocks. Just be aware that here also the downside risk is clearly present, especially in India, when the current support level (where the market is resting at the moment) gives way.
#StaySafe and have a great weekend!, --Julius
My regular blog is the RRG Charts blog. If you would like to receive a notification when a new article is published there, "Subscribe" with your email address.
Julius de Kempenaer
Senior Technical Analyst, StockCharts.com
Creator, Relative Rotation Graphs
Founder, RRG Research
Host of: Sector Spotlight
Please find my handles for social media channels under the Bio below.
Feedback, comments or questions are welcome at Juliusdk@stockcharts.com. I cannot promise to respond to each and every message, but I will certainly read them and, where reasonably possible, use the feedback and comments or answer questions.
To discuss RRG with me on S.C.A.N., tag me using the handle Julius_RRG.
RRG, Relative Rotation Graphs, JdK RS-Ratio, and JdK RS-Momentum are registered trademarks of RRG Research.


