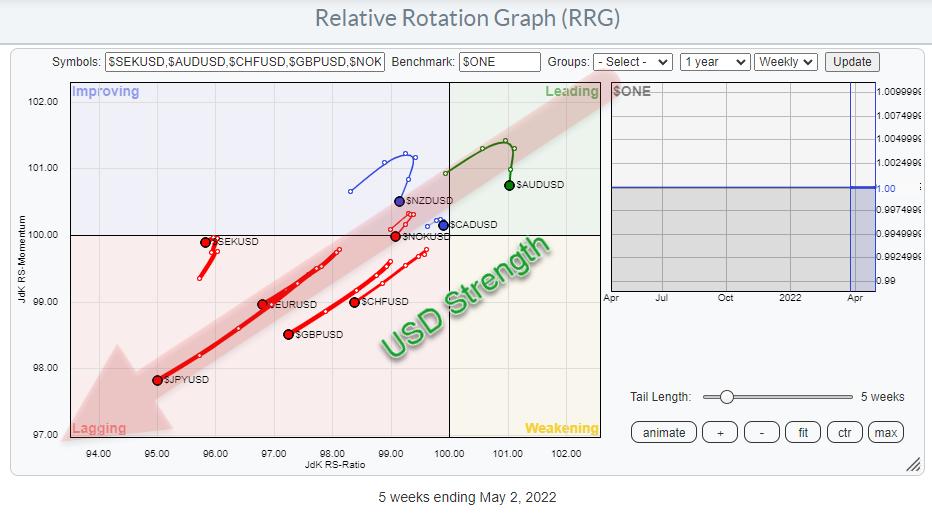
The Relative Rotation Graph that shows the rotation for currencies against the USD as the base is sending us a very clear picture!
USD Strength
The graph holds the G10 currencies. As we are plotting against the USD base, it means that there are nine tails on the canvas and the USD is the center of the chart.
The message coming from this image is pretty clear; all nine tails are at a negative RRG-Heading, which means that they are losing on both the JdK RS-Ratio and the JdK RS-Momentum scales. This makes the USD the strongest currency in this universe at the moment.
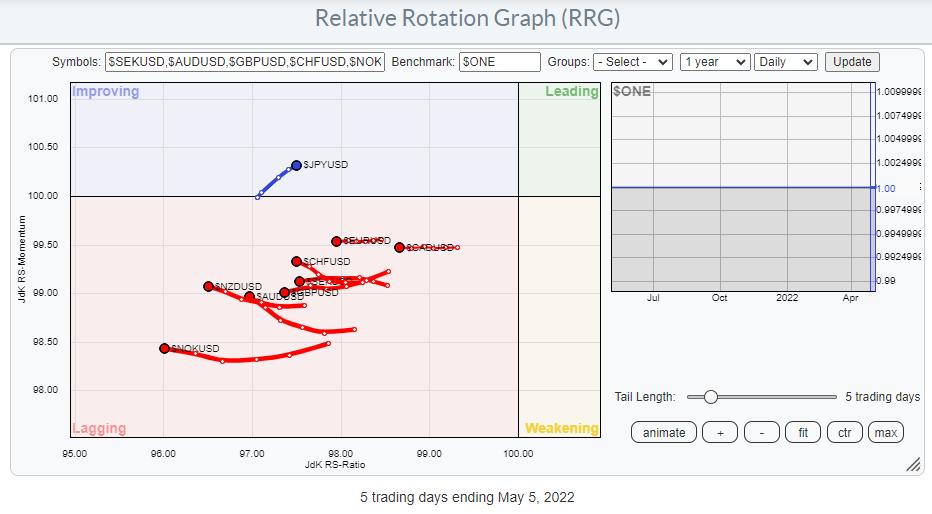
Running the same group of currencies on a daily RRG underscores what is happening on the weekly picture above. All currencies are to the left of the benchmark (USD) and moving lower on the RS-Ratio scale, i.e. losing (relative) strength vs the USD.
$JPYUSD is the only exception inside the improving quadrant. Looking at the weekly tail for $JPYUSD, which is deep inside the lagging quadrant at the longest tail, suggests that the rotation through improving on the daily RRG is temporary in nature and that a return towards lagging, without hitting leading, is likely.
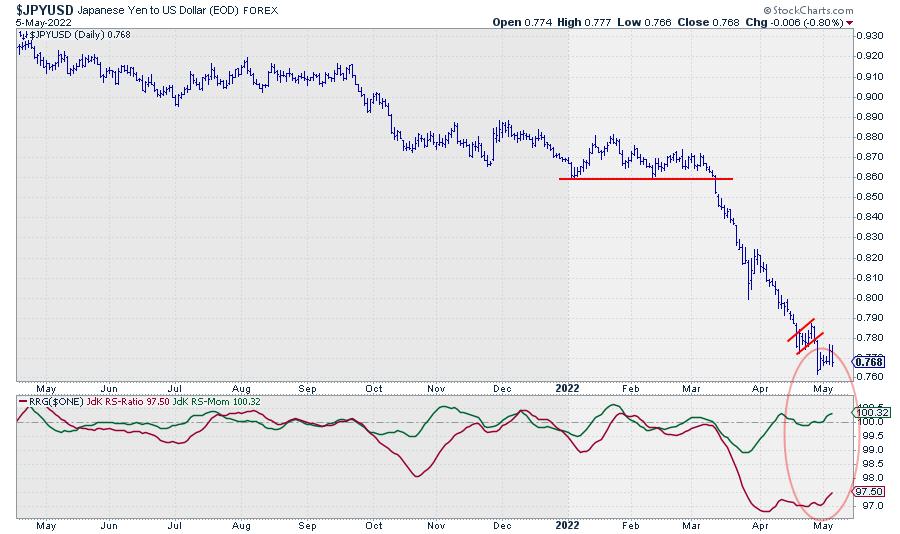
The price chart of $JPYUSD shows the deceleration in the decline, which causes relative momentum, followed by relative strength, to pick up. The trend itself is still very clearly down. It will take time and quite a bit of JPY buying power to turn this thing back up.
When you play the animation on the RRG chart over the past year, you can see that this USD strength has been in play for quite a few months already. It all started when a large H&S top-formation was completed in the EUR/USD graph in August 2021.
In my Sector Spotlight show every Tuesday on StockCharts TV, I assess the rotation of asset classes, including the USD, on a regular basis, including a look at the EUR/USD chart from time to time. For this occasion, I want to pull up a very long-term chart of EUR/USD, as we are again nearing crucial levels.
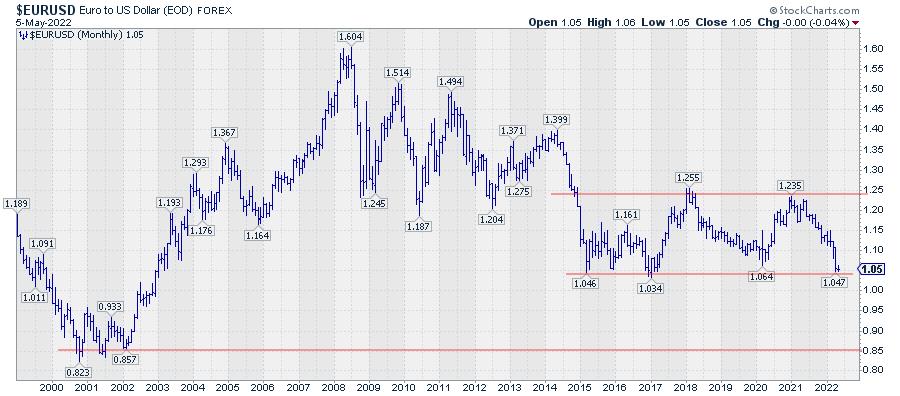
The monthly EUR/USD chart above shows a wide trading range between roughly 1.04 and 1.25, which started after the first dip to 1.046 at the beginning of 2015. The recent decline has taken EUR/USD back very close to this level.
Obviously, this is a major level of support. Two things can happen -- either the market holds up here, and we will see a bounce and the range remains intact, or this support level will be broken, and we will see an acceleration lower.
Based on the height of this 7-year range (~0.20) we may project this amount below the breakout level to get a potential target price. This comes out around 0.85 which is exactly the area where EUR/USD bottomed in 2001/2002.
We have to wait and see, but it is clear that EUR/USD is in a critical phase.
Because of the importance of the levels, good trading opportunities will likely arise in both scenarios. When support holds, there is roughly 20 cents upward potential towards the top of the range with support nearby. When support breaks, there is roughly 20 cents downward risk towards 0.85, with old support turning into resistance just a notch higher.
Have a great weekend and #StaySafe, --Julius
My regular blog is the RRG Charts blog. If you would like to receive a notification when a new article is published there, "Subscribe" with your email address.
Julius de Kempenaer
Senior Technical Analyst, StockCharts.com
Creator, Relative Rotation Graphs
Founder, RRG Research
Host of: Sector Spotlight
Please find my handles for social media channels under the Bio below.
Feedback, comments or questions are welcome at Juliusdk@stockcharts.com. I cannot promise to respond to each and every message, but I will certainly read them and, where reasonably possible, use the feedback and comments or answer questions.
To discuss RRG with me on S.C.A.N., tag me using the handle Julius_RRG.
RRG, Relative Rotation Graphs, JdK RS-Ratio, and JdK RS-Momentum are registered trademarks of RRG Research.


