
Driving into a dense fog of economic data can sometimes trigger something of an analytical spinout, where directionality and objects on the road are first felt, via gravity and impact, before they're seen. The January Personal Consumption Expenditure (PCE) report released this morning added another layer to this thick screen of doubt and obfuscation.
In short, inflation, following the last consumer price index (CPI) and producer price index (PPI) reports, came in higher than economists had hoped. The figures dealt yet another sobering dose of economic reality, indicating that inflation, so far, has proven more resilient than the monetary medicine the Fed has administered to cool it down.
What's at Stake Is the Shape of the Landing
Are we going to see a "soft landing," a hard landing, or no landing at all—a question Mish Schneider thoroughly examined in an article earlier this week? (Hint: Mish explores a potential "stagflationary" scenario). While the Fed's Bullard and Mester expressed confidence that it can tame inflation without tipping the economy into a recession, other analysts would beg to differ.
This is the main issue investors seem to be struggling with, and the volatile tracks of price action leaves plenty of evidence that confusion seems to be leading the way. Based on today's data, it's likely that there's more to come in the way of Fed rate hikes. And the central bank may even choose to accelerate the program a bit.
Bullish Optimism Amid a Bearish Stomp
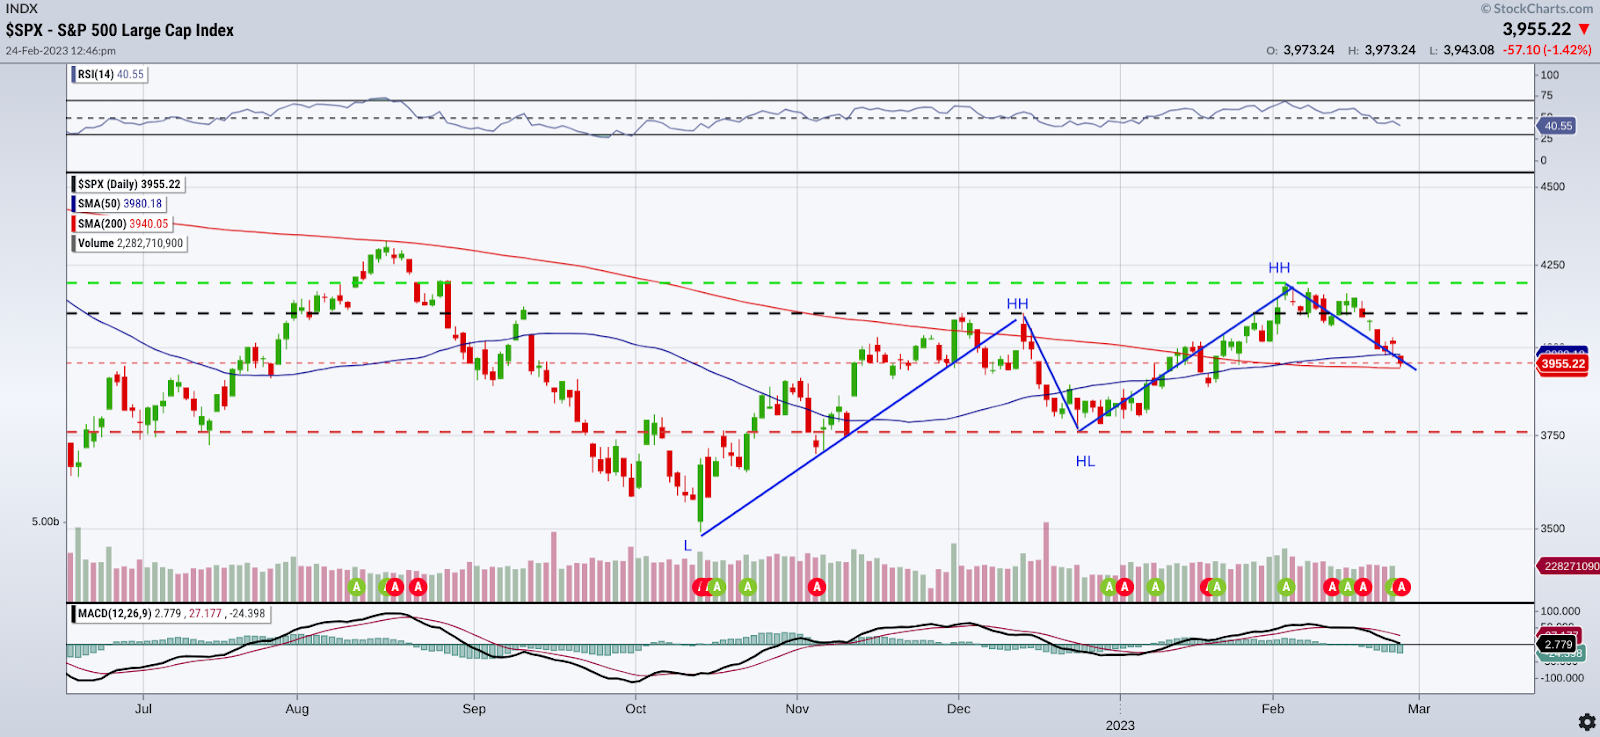
The S&P 500 index ($SPX) has fallen significantly from its January 2002 high. Still, its 10% rise from October 2022 smacks of an optimistic bounceback from a harrowing plunge (see chart below).
Some analysts call this bounceback a "head fake." The same can be said of fundamental data, considering how many banks have included the R-word (recession) in their client announcements (JPM Chase, BofA, and Citi among the big ones) versus the central bank itself.
On the technical front, we see a golden cross emerging bullishly against the doubtful backdrop of a falling moving average convergence/divergence (MACD) cross and receding relative strength index (RSI) line. It's about as convincing as the confusing and shifting slew of recent economic data.
When in Doubt, Go Back to the Basics
When your powers of market prediction hit a wall called "present time" and no analytical data proves sufficient enough to resolve forecasting dilemmas (i.e. inflation or recession, soft/hard/no landing, bullish reversal vs. bear market rally), sometimes it helps to get back to the basics.
Trends (or our perception of trends) tend to fluctuate, sort of like inflation data, or current mortgage rate changes. We can't predict trends (a shout out to legendary trend follower Ed Seykota, who said "trends do not exist in the now") but we can anticipate their form using simple formulas, like Uptrend = Higher Highs (HH) and Higher Lows (HL). In short, let's look at basic price action.
Following this basic principle, we can see in the chart above where the consecutive swing highs and swing lows are positioned (see blue lines). And we see that, in December 2022, the S&P broke through triple resistance at 4100 (black line).
If you were to follow the basic uptrend principle of HH and HL, then here's what to expect: A bullish recovery from October lows means that price must break above the most recent swing high (resistance) at 4195.44 while staying above the most recent swing low (support) of 3764.50. Failure to break out of this level can mean a delayed recovery or a descent into a ranging market. But failure to hold above support can sour sentiment, leading to a retest of support levels at 3698.00 and then, if lower, a retest of the October low itself at 3491.00.
Get a Broader View
If you're trading the broader market, it helps to look at intermarket factors and markets that can provide significant insights toward current market action. Jayanthi Gopalakrishnan's article Hey Stock Market! Where Are You Heading? takes this big-picture approach. Wide-ranging insights may not lead to better predictions, but they can lead to more accurate and actionable setups and alternative scenarios.

Disclaimer: This blog is for educational purposes only and should not be construed as financial advice. The ideas and strategies should never be used without first assessing your personal and financial situation, or without consulting a financial professional.
Happy charting!


