
The May Housing Starts and Permits released this past Tuesday was quite eye-popping, despite riding the back of a disappointing market drop in the Dow, S&P, and Nasdaq.
How so? If you think about it, mortgage rates are averaging a painful 7%+. And still demand for homes rebounded, with 1.63 million housing starts last month, far above the 1.39 million economists were expecting.
A Bullish Reversal for the Housing Sector?
Quite possibly. If anything, Tuesday's data gave us yet another indication that the US economy is robust, despite the uncertainties that continue to plague it. If you can remember, housing was the first to get hit once the Fed began tightening. So is it now the first to bottom?
Housing Is a Leading Indicator (On the Fundamental Side)
Another plus is that the increase in demand for homes, especially new ones, indicates more spending. For new homes, it indicates demand for construction labor and materials. It also points to more spending across Consumer Staples and Consumer Discretionary sectors; basically, all the things that make a house a "home." In other words, home spending begets even more spending for home stuff.
Time to Jump Into Homebuilder Stocks?
So, to sum it all up...
- Housing data is showing signs of recovery amid high mortgage rates.
- 10-year Treasuries are holding steady.
- The Fed had set expectations for two more rate hikes before the end of the year.
- Homeowners whose property values didn't sink as low as expected during the housing recession are helping keep afloat consumer spending (which may be a factor keeping the economy from falling into a recession).
Time to jump into homebuilders? Let's look at the charts for four of the biggest homebuilder stocks in the sector: DR Horton, Inc (DHI), Toll Brothers, Inc (TOL), PulteGroup, Inc (PHM), and Lennar Corporation (LEN).
Analyzing on a Comparative Basis
First, let's take a look at all four charts stacked together using StockChartsACP.
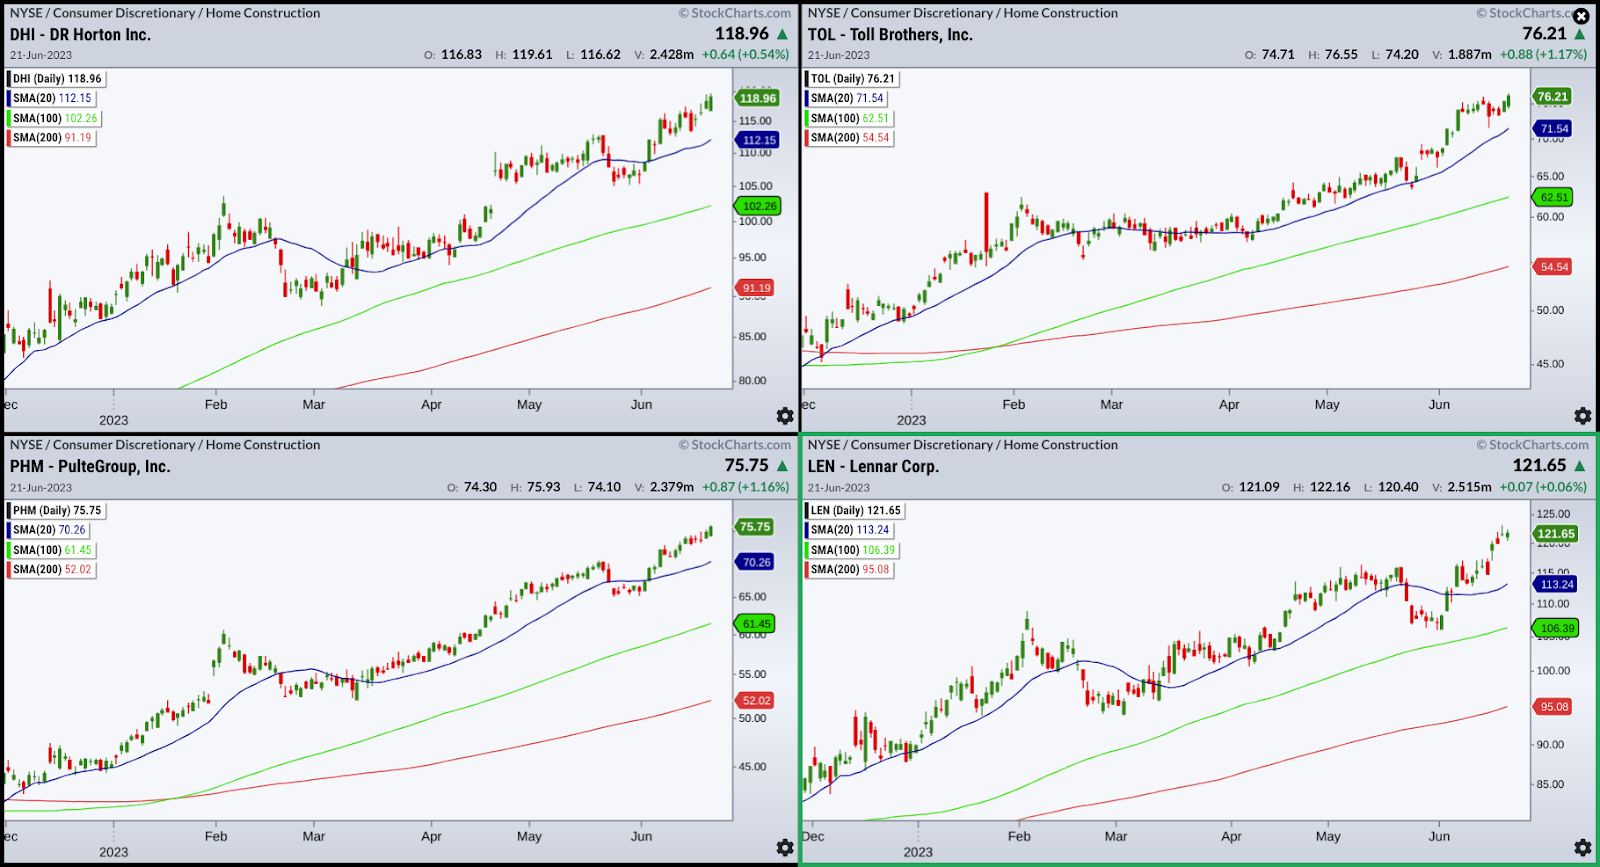
CHART 1: DHI, TOL, PHM, AND LEN STACKED SIDE BY SIDE. The 50-day, 100-day, and 200-day Simple Moving Averages illustrate the strength of each stock's upward advance on a comparative scale.Chart source: StockChartsACP. For illustrative purposes only.
At a glance, all four stocks are trending upward.
- All three moving averages—the 50-day Simple Moving Average (SMA), 100-day SMA, and 200-day SMA—appear (mostly) fully extended.
- Momentum-wise, you can see that PHM and TOL appear the strongest, having barely traded below the 50-day SMA. LEN, on the other hand, appears to be the laggard among the four, having tangled with the 50-day SMA more frequently than the rest of the group.
 To explore the different layouts in StockChartsACP, check out this video.
Looking at the four homebuilders from a quarterly perspective, PerfCharts provides a clearer picture of their comparative performance.
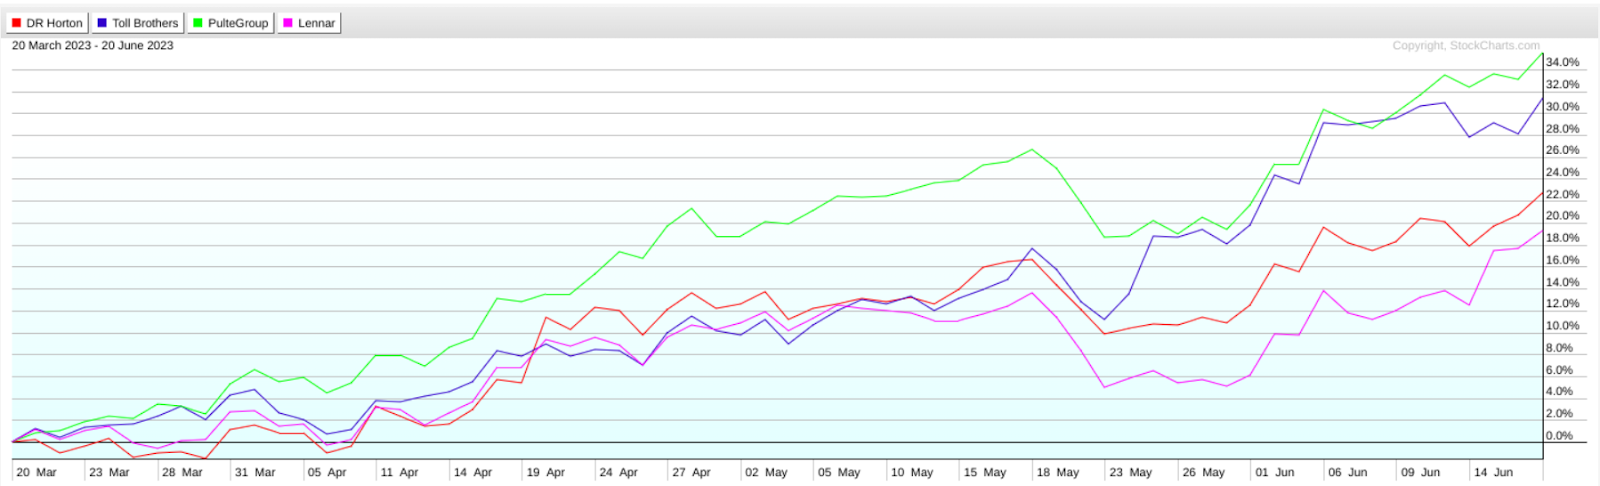
CHART 2: A 3-MONTH COMPARATIVE LOOK AT PERFORMANCE USING PERFCHARTS. PHM is the clear leader, with TOL, DHI, and LEN pacing behind (and in that order).Chart source: StockCharts.com. For illustrative purposes only.
Now you can more clearly assess the group's performance leadership, and if you were to look at each stock's three-month StockCharts Technical Rank Score (SCTR) score, it would align with the PerfChart reading, with PHM leading the pack and LEN straggling behind.
More specifically, the SCTR scores (at the time of writing) are as follows: PHM 97.8, TOL 95.8, DHI 93, and LEN 92.5.
Are These Stocks "Toppy" or Is There Room for More Upside?
When you're buying an uptrending stock, you're assuming the stock is still relatively undervalued, meaning there's room for more upside. But still, you probably want to avoid entering a position bound for a sizable "dip."
So, to figure out which of these stocks might be overbought and possibly topping, let's take a look at each chart, pull up a Stochastic Oscillator to see if any occupy the overbought range, and take a look at the stocks' momentum profile, checking buying pressure against selling pressure using the Chaikin Money Flow (CMF).
Let's look at each chart, note a few characteristics unique to each stock, and then do an overall assessment after looking at all four.
DHI: Sellers Tip Their Hand
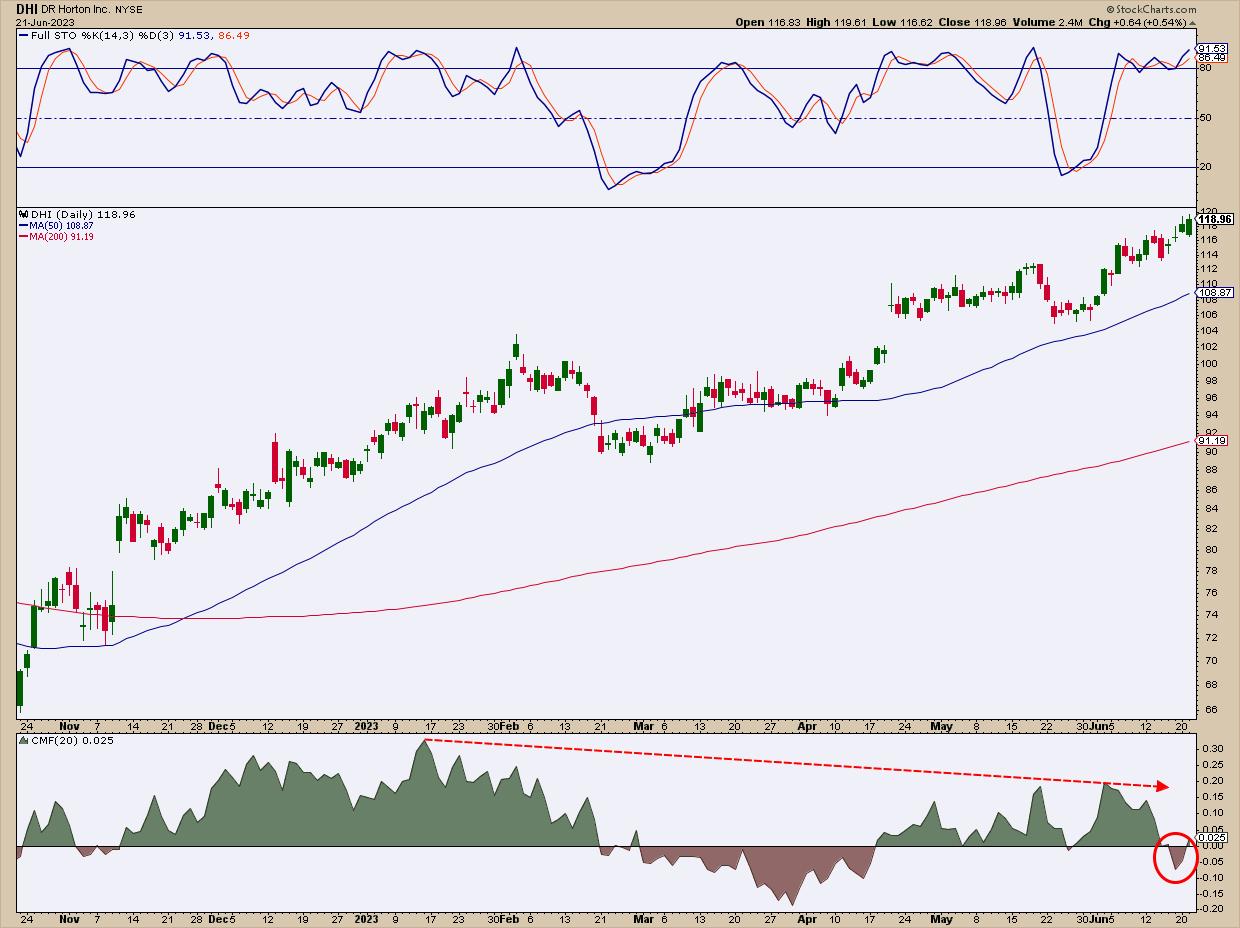
CHART 3: DAILY CHART OF DHI. What sticks out is the bearish divergence between price and the CMF and that money flow has crossed below the zero line.Chart source: StockCharts.com (click on chart for live version). For illustrative purposes only.
- According to the Stochastic Oscillator, DHI is clearly in overbought territory.
- Notice the bearish divergence between the trend and the CMF, now falling below the zero line into negative territory. This indicates selling pressure amid DHI's flight to higher valuations.
TOL May Be Topping, But Not as Badly as DHI
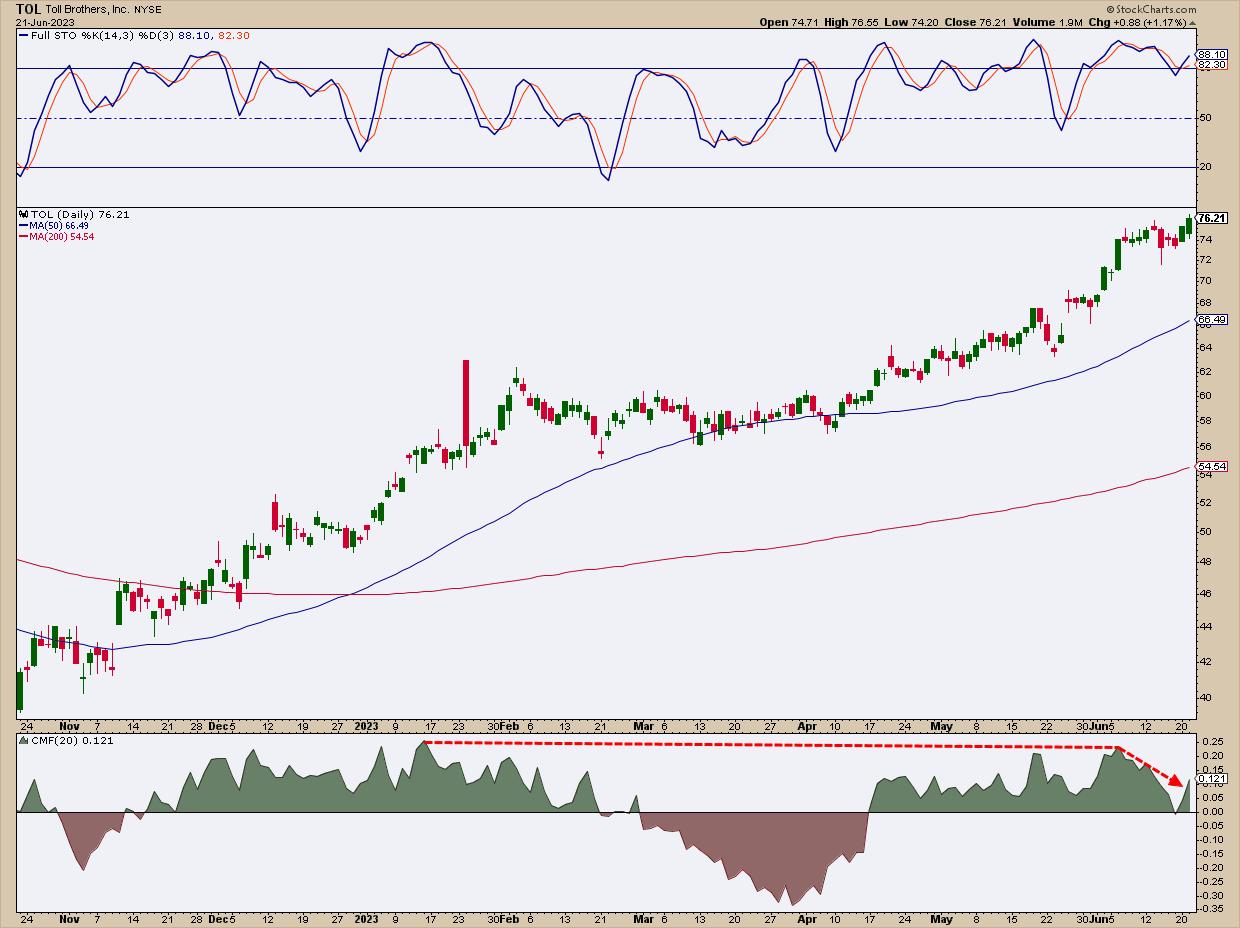
CHART 4: DAILY CHART OF TOL. Price appears to be advancing with strong momentum, and, unlike the other three charts in the group, the divergence between price and money flow appears to be relatively near-term.Chart source: StockCharts.com (click on chart for live version). For illustrative purposes only.
- TOL is also giving us an overbought stochastic reading.
- While the CMF shows a sharp divergence in the near-term (longer-term divergence is barely visible), money flow crossed over to negative territory.
PHM: The Outperformer of the Pack Seems Bound for a Pullback
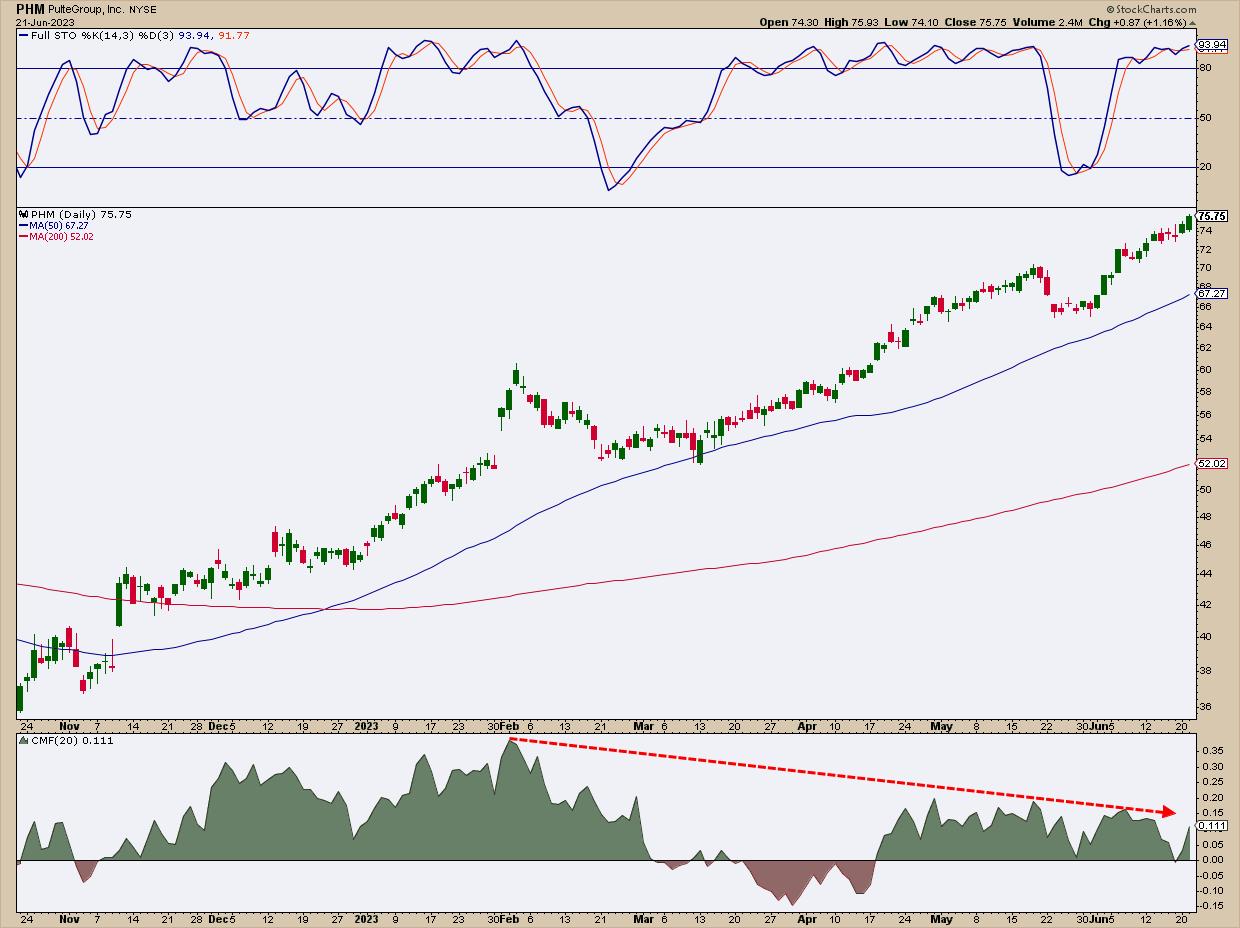
CHART 5: DAILY CHART OF PHM. Despite leading the other three in terms of performance, PHM's advance seems overdue for a pullback.Chart source: StockCharts.com (click chart for live version). For illustrative purposes only.
- Remember that PHM is the strongest performer among the group (at least over the last quarter).
- You can clearly see price advancing strongly, its forward momentum stretching both 50-day and 200-day moving averages into full sail.
- Also notice the clear divergence between price and money flow for the past four months.
LEN the Laggard
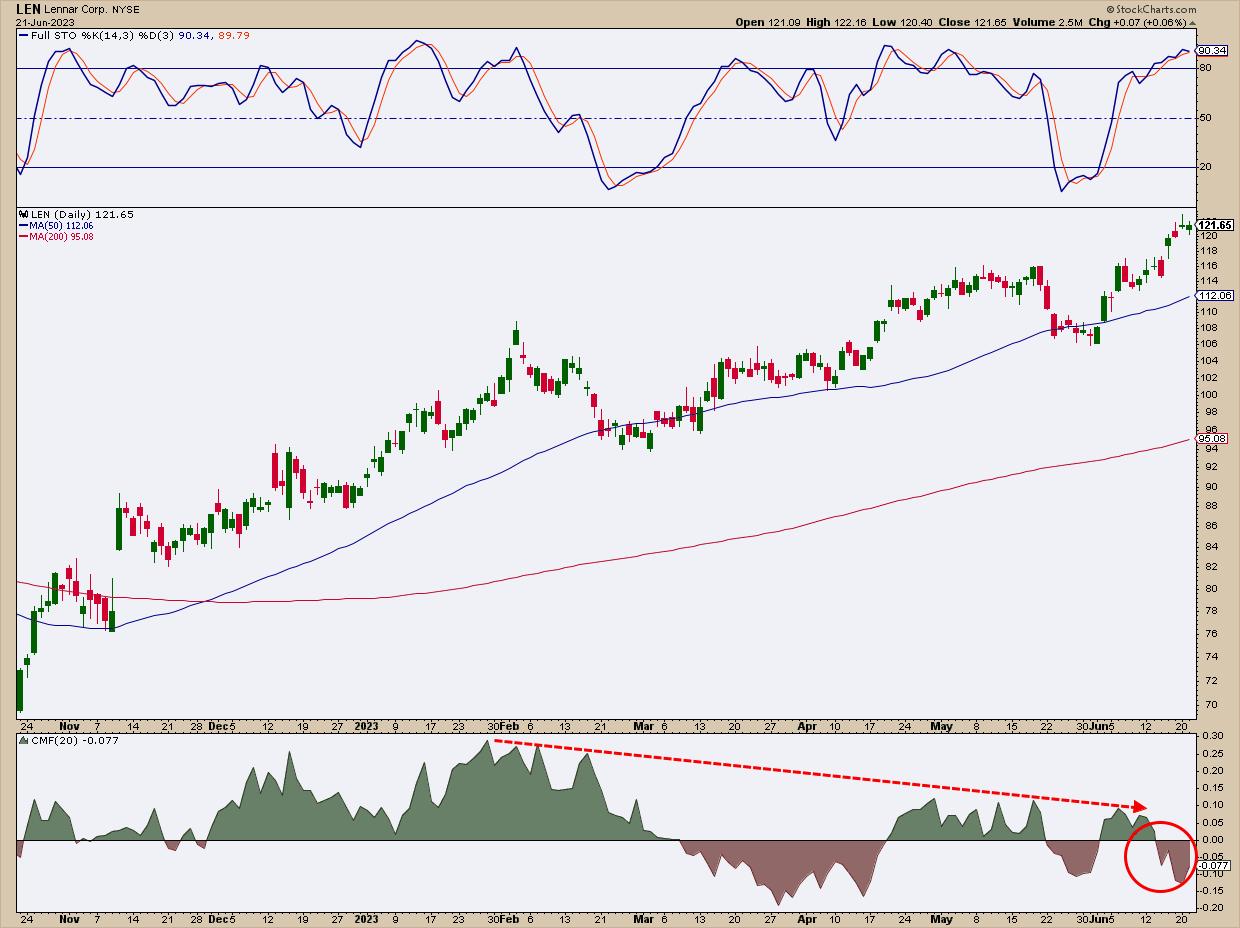
CHART 6: DAILY CHART OF LEN. Perhaps more than the other three stocks in the group, LEN appears to be losing steam based on its performance relative to its 50-day SMA and negative CMF reading.Chart source: StockCharts.com (click chart for live version). For illustrative purposes only.
- LEN's performance relative to the group has been the weakest, at least over the last quarter.
- Similar to DHI, LEN is also overbought, exhibiting longer-term price divergence, and has fallen into negative CMF territory.
After looking over the four homebuilders, how do you trade them?
How to Trade the Homebuilders
Your best bet here is to sit and wait. All four stocks—DHI, TOL, PHM, and LEN—are in record-high territory (aka, all-time highs). Although all four are trending rather strongly, it's hard to look past the likelihood that they're poised for a breather.
What this means is that it's best to wait for a pullback. Both the stochastic and CMF readings indicate that a dip is highly likely in the near term, as buying pressure appears to be dwindling even as momentum continues to push prices upward.
Once the stocks have topped, it will be easier to set clear buy levels (such as using Fib retracements to measure potential buy zones). But until then, look to swing levels and the 50-day and 200-day moving averages for potential support.
The Bottom Line
Despite a challenging economic climate and high mortgage rates, the US housing market is showing encouraging signs of recovery. Major homebuilder stocks like DHI, TOL, PHM, and LEN are trending upwards, indicating a bullish reversal in the sector. However, you might want to sit and wait for a possible near-term pullback before jumping in. All four are showing overbought conditions and dwindling buying pressure. But once a relative top is in place, it will be easier to target your potential buy points.

Disclaimer: This blog is for educational purposes only and should not be construed as financial advice. The ideas and strategies should never be used without first assessing your own personal and financial situation, or without consulting a financial professional.
Happy charting!
