
Maybe you were expecting the dollar to fall a bit more dramatically (and for gold to rise) when, after the FOMC meeting yesterday, the Federal Reserve announced that it was holding interest rates steady for the first time after 10 consecutive hikes. But the bearish response was a bit lackluster.
Why So Tepid a Response?
Well, a "skip" in hiking interest rates is a skip, meaning the central bank will hike rates again after taking a breather to analyze the current economic environment and to take in more data. So, the central bank left the Fed Funds rate unchanged at 5.00–5.25%, but it also hinted that two more are in store before the end of the year.
So, for dollar bears (and gold bulls), the near-term forecast is pretty much what the technicals have indicated for weeks: the dollar is heading toward a decline. Just how far and to where? Let's take a closer look, using the Invesco DB US Dollar Index Bullish Fund (UUP) as our dollar proxy.
On a Weekly Scale, UUP's Looking Up After a Breather
The weekly chart of UUP appears pretty bullish, except that it's looking to test support near the $27.50 range. But before getting into that, let's look at the bullish indicators (see chart below).
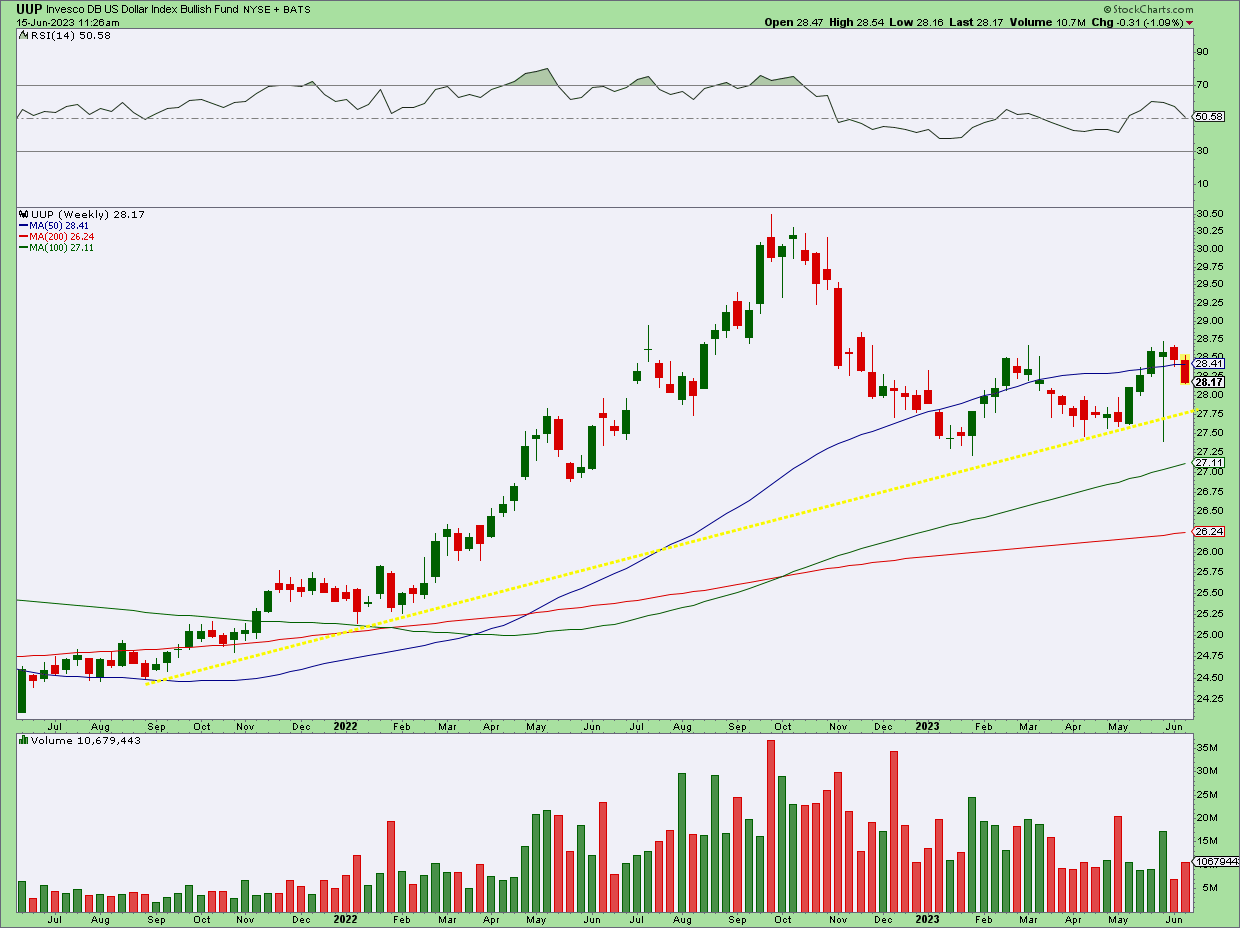
CHART 1: WEEKLY UUP CHART SHOWS A SLIGHTLY WEAKENING UPTREND. Price is looking to test support between $27.25 and $27.50 for a third time, potentially forming a triple bottom. Chart source: StockCharts.com. For illustrative purposes only.
UUP's price may be whipsawing the 50-period Simple Moving Average (SMA), but it's also holding well above the trendline projected from September 2021. The 50-period, 100-period, and 200-period SMAs are also in full sail, indicating a fairly strong uptrend, despite remaining in "overbought" territory for six months in 2022, based on the Relative Strength Index (RSI) reading.
Here's the thing: If you're looking to go long UUP, the price action on a weekly scale may seem to paint a bullish picture (because it is, technically speaking). But the distance between where the price is now and how much further down it can go can seem pretty alarming once you zoom in for a closer look.
On A Daily Chart, UUP Appears to Be Tripling Its Bottom
If you look at the price action on a daily scale, the situation doesn't look very favorable, at least not yet.

CHART 2: DAILY CHART OF UUP. The blue rectangle illustrates the anticipated support range. In addition, you can see that prices appear bound to test support for a third time, potentially forming a triple bottom.Chart source: StockCharts.com. For illustrative purposes only.
Prices bottomed once in February at $27.22 and again between April and May near the $27.75 range. Technically, there was a third, rather dramatic drop, followed by an equally dramatic rejection/bounce in June at that same level. Now, prices are looking to work their way back down to test support again for a third time. Are we looking at a possible Triple Bottom Reversal? Should the price move to test its previous support range, we're looking at a 3% drop from current prices.
On the upside, however, take a look at the difference in the Chaikin Money Flow (CMF), corresponding with the price peaks on March 7 and June 2 (see red vertical arrows). Simply put, the difference in buying pressure is immense and, to that end, immensely bullish.
How to Trade UUP
- First, UUP is clearly sinking today. Rate hikes may be bullish, but not for the near term. Allow the anticipated formation (testing support third time) to play out.
- An aggressive entry point would be to go long when price reaches or sinks below $27.75, with a stop below $27.20. A more conservative entry point, though one with greater price risk, is to wait for price to break above the most recent swing high at $28.72, placing a stop below $27.50 (or lower depending on how much further down price declines).
- If you plan on swing trading UUP, then you might want to measure the height of the formation, which is currently $1.50 (High of 28.72 - Low of 27.22 - 1.50) and add that, or a multiple of that figure, to the top of the formation at $27.82 for a price target. Your stop would be around $27.20, or wherever you see fit according to your trading strategy.
The Bottom Line
The Federal Reserve's pause in rate hikes is causing a near-term dollar decline, and prices are looking to form a classic triple bottom pattern. But given the rate hikes to come, there is plenty of upside room for UUP to run once it completes the current pattern. Monitor the market closely, and if you're looking to go long the dollar, strategically choose your entry point based on your time frame, risk tolerance, and return expectations (e.g. swing trade versus longer-term position trade).

Disclaimer: This blog is for educational purposes only and should not be construed as financial advice. The ideas and strategies should never be used without first assessing your own personal and financial situation, or without consulting a financial professional.
Happy charting!
