
Artificial intelligence (AI) stocks have become popular, almost fashionable. AI is a new frontier, an emerging technology offering unique opportunities and risks -- but is it a smart investment?
Why invest in AI?
AI has the capacity to revolutionize industries, drive economic growth, impact global challenges, and unlock scalable efficiency. These present opportunities to make a fortune if you buy the right stocks early. But some of the best stocks may not be the popular names.
True, many AI stocks are not common names; the AI space requires in-depth knowledge that many investors may still need to gain. So what if you're unwilling to go the individual stock route? Well, investing in an AI exchange-traded fund (ETF) is the simple answer.
Comparing Top AI ETFs Using StockCharts Tools
Consider these four funds:
- Global X Robotics & Artificial Intelligence ETF (BOTZ);
- ROBO Global Robotics & Automation ETF (ROBO);
- iShares Robotics and Artificial Intelligence Multisector ETF (IRBO); and
- ARK Autonomous Tech & Robotics ETF (ARKQ)
You can pull up the PerfCharts tool and look at their three-month performance to get an overarching view of the ETF's performance.
StockCharts Tip: You can access the PerfCharts tool by following this path: Charts & Tools > PerfCharts > enter ETF symbols in the input box separated by commas > Go.
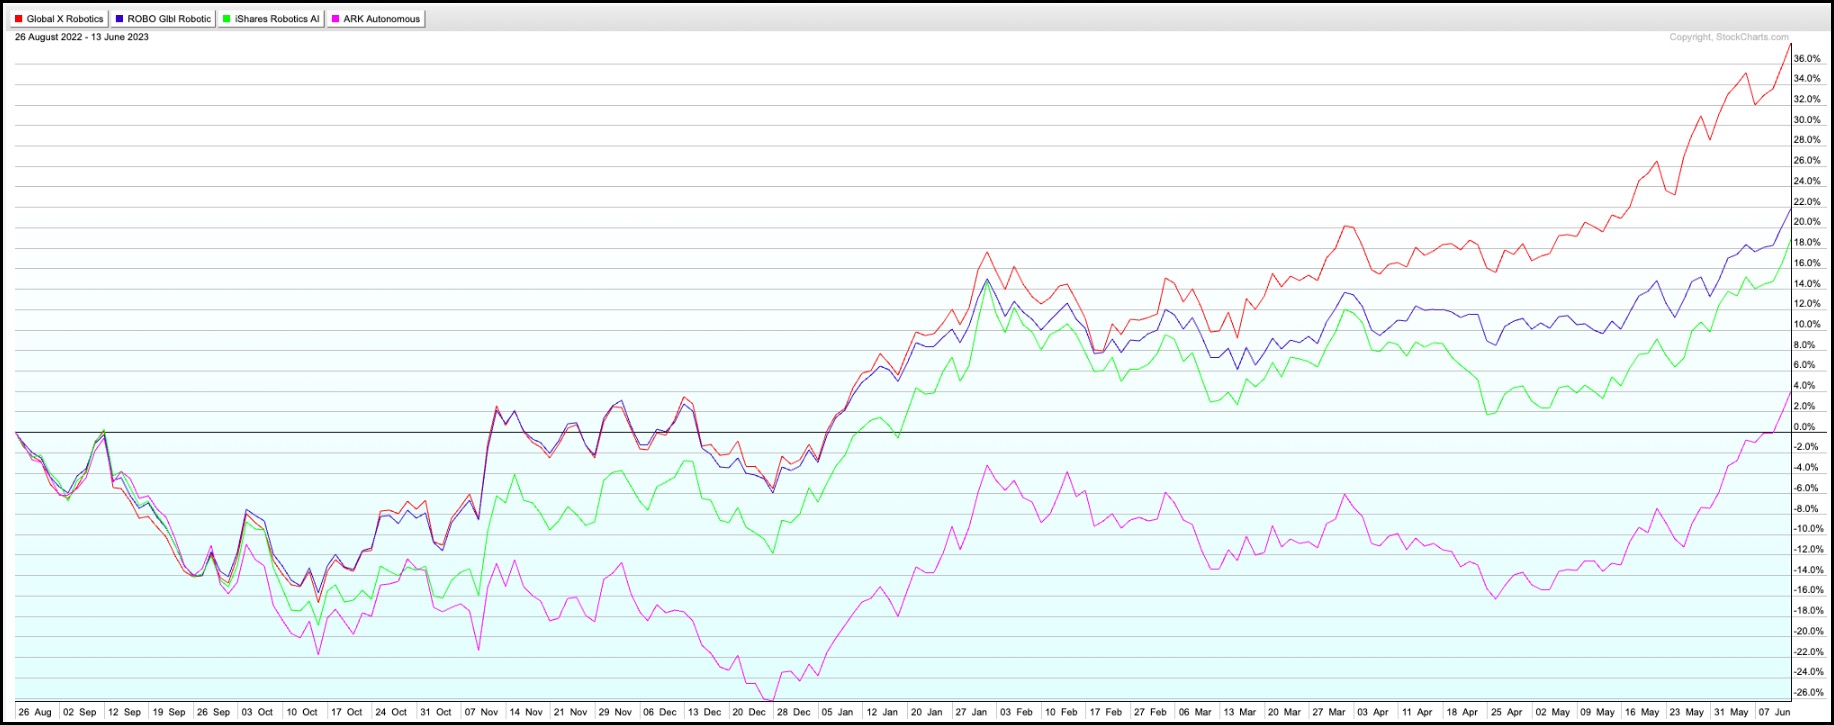
CHART 1: ANALYZING PERFORMANCE OF THE FOUR ETFS. BOTZ is the clear outperformer with ARKQ surging to occupy second place in late May.Chart source: StockCharts.com. For illustrative purposes only.
On a quarterly basis, BOTZ is the clear leader by far, with ARKQ surging ahead to take the second-runner-up spot. Before delving deeper into this, let's look at the ETFs comparatively against the S&P 500 index as a benchmark.
The Relative Rotation Graph (RRG) is a great tool for this. Here's how to view the three-month rotation.
- From Charts & Tools, select Launch RRG Charts.
- Enter BOTZ, ROBO, IRBO, ARKQ in the symbol box.
- Select the 3-month rotation graph and Daily from the dropdown menus (to view daily nodes).
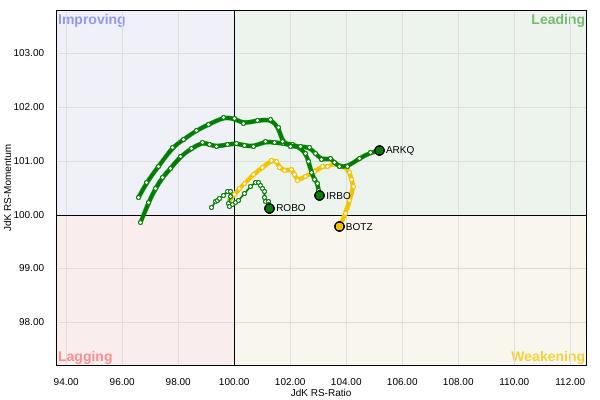
CHART 2: RELATIVE ROTATION GRAPH OF THE FOUR ETFS. BOTZ is moving toward a position of weakness, whereas ARKQ appears to be strengthening. Chart source: StockCharts.com. For illustrative purposes only.
This gives you a more nuanced perspective on the PerfCharts reading. Whereas BOTZ is the clear leader based on performance, it's receding toward a position of weakness when compared to the S&P 500. ARKQ, the second runner up, appears to be the only ETF sustaining upward momentum in the RRG's "Leading" space.
Now, let's look at the technicals for each ETF.
Three Hanging Men and a Runaway Gap
BOTZ: Hanging Man
BOTZ owns shares in 43 global companies that will likely profit as robots and artificial intelligence use increases. Most companies are in the Technology, Industrial, and Health Care sectors. While over 40% of the companies are based in the United States, there are also quite a few from Japan and Switzerland.
StockCharts Tip: For a deeper dive into these funds, enter the ETF symbol in the Symbol Summary, which you can find in Summary Pages under Charts & Tools.
While hanging man patterns are traditionally looked at as bearish reversal patterns, some analysts would argue that almost half of all occurrences serve as bullish continuation patterns (according to Thomas Bulkowski's Encyclopedia of Chart Patterns).
BOTZ's hanging man, however, looks like it's due for a pullback. As price surges upward, leading to the current hanging man candle, the RSI and Stochastic Oscillator remain flat in "overbought" territory while the Chaikin Money Flow (CMF) gives clear divergence reading, indicating that buying pressure has been receding (confirming the bearish indication of the hanging man candle, however small or large the pullback may be).
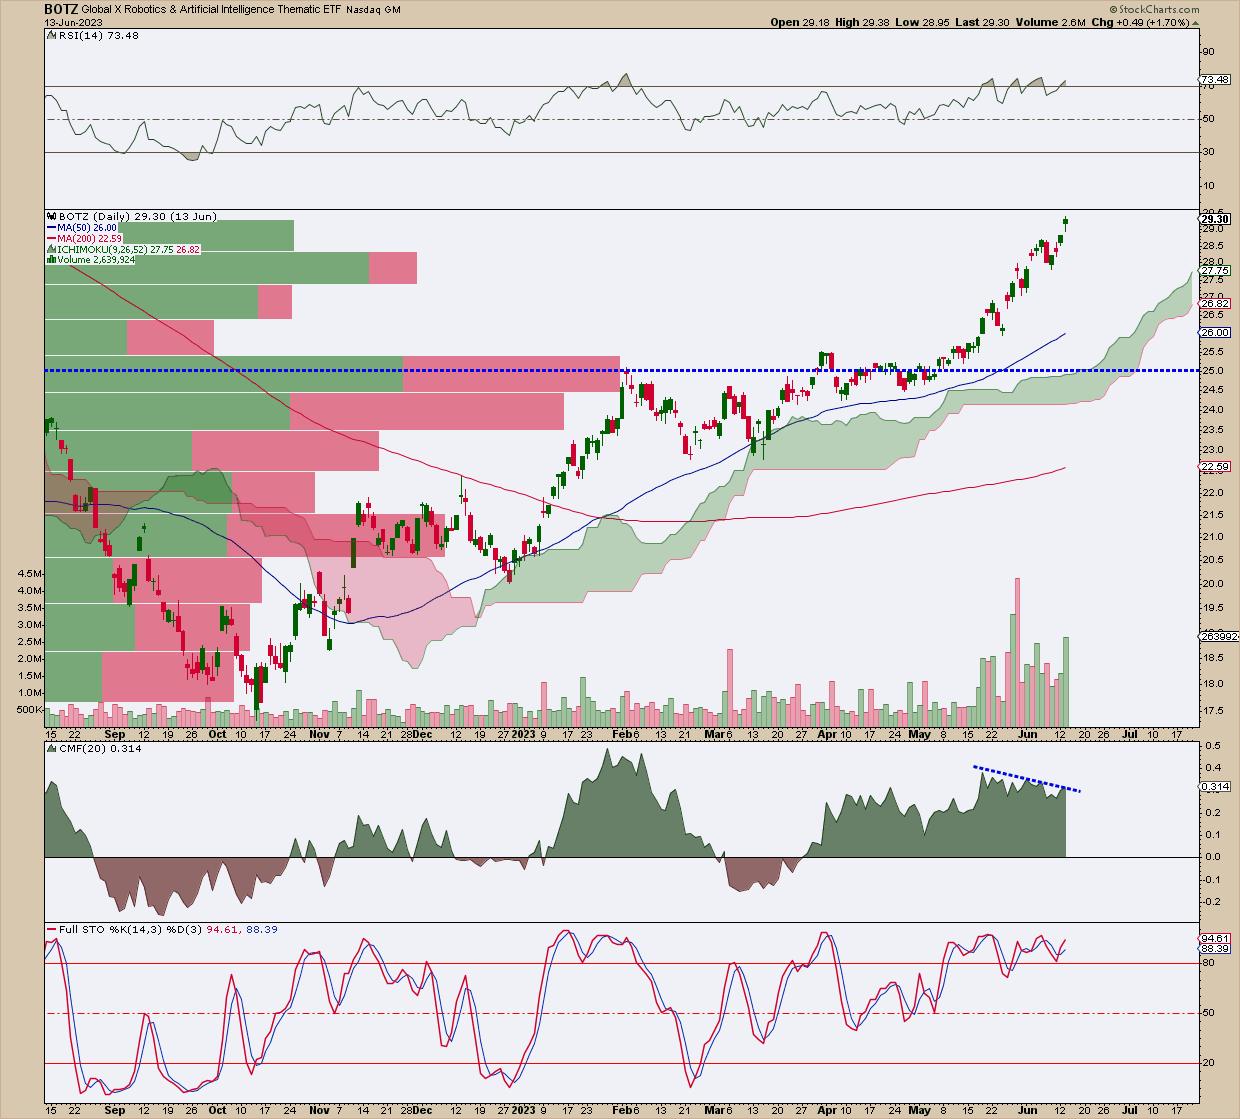
CHART 3: HANGING MAN IN BOTZ. The appearance of a hanging pattern indicates this ETF could be due for a pullback. The RSI and Stochastic Oscillator are in overbought territory, whereas the Chaikin Money Flow is showing that buying pressure is reducing.Chart source: StockCharts.com (click on chart for live version). For illustrative purposes only.
The $25.00 range marks a general area in which multiple support levels (or indications) converge, First, $25 sees plenty of resistance turned support, as it also marks a level of heavy trading over the last six months (see the Volume by Price bar). Surrounding that level, you have a rising 50-day and 200-day simple moving average (SMA) further supported by a green Ichimoku cloud range. If you're looking to go long on BOTZ, it's probably a good idea to wait for the ETF to pull back before pulling the trigger.
ROBO: Another Hanging Man
ROBO has shares in 80 companies that are pushing the boundaries in robotics and artificial intelligence. The biggest company in this fund, Harmonic Drive Systems, makes up less than 2.5% of the total investments. Other key companies in the fund are IPG Photonics, Kardex Holding, Zebra Technologies, and ServiceNow.
Similar to BOTZ, it's another hanging man but this one looks slightly different.
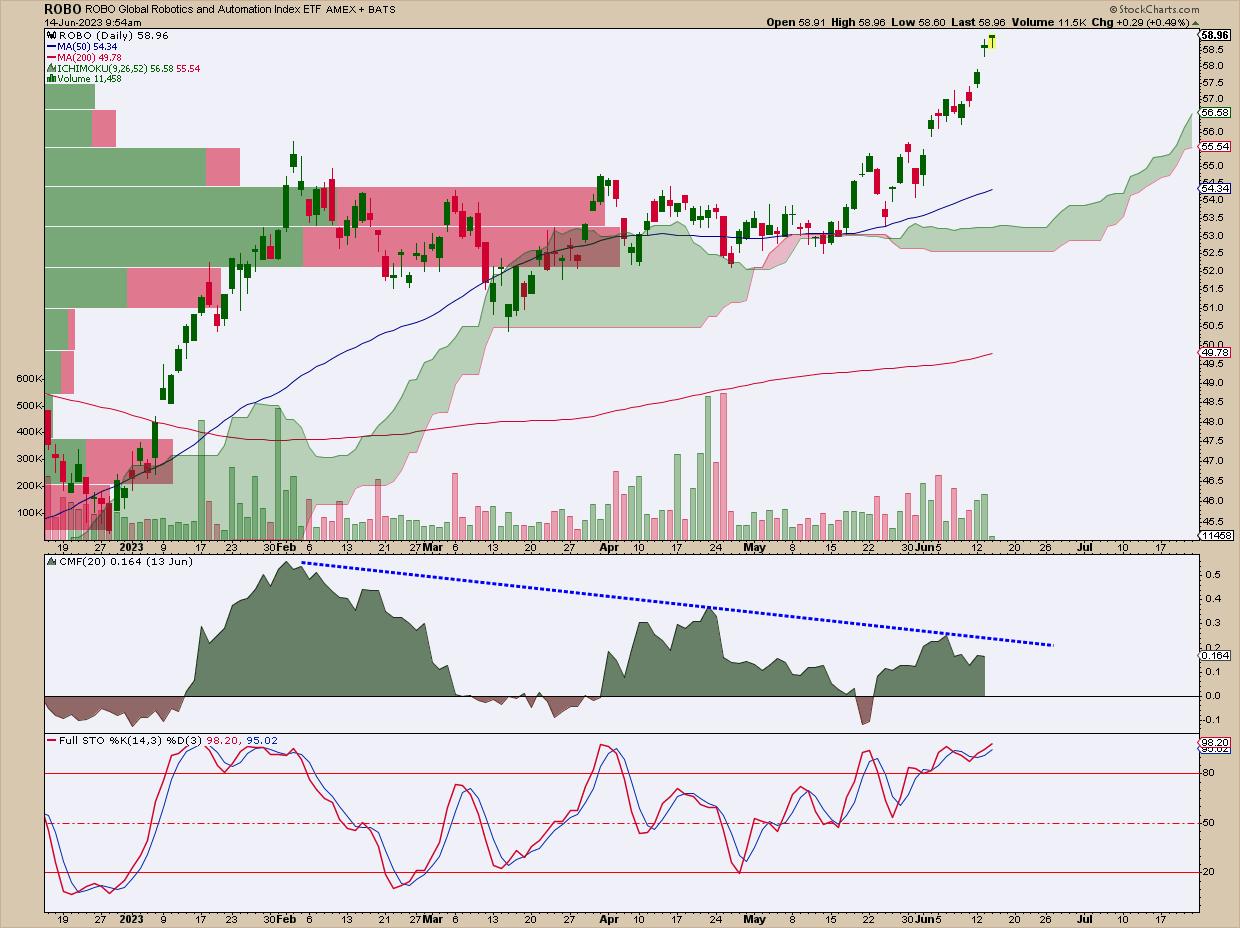
CHART 4: ROBO LOOKING TOPPY. The divergence between price and CMF and the $54.24 support level are two factors to keep an eye on.Chart source: StockCharts.com (click on chart for live version). For illustrative purposes only.
Notice how the CMF has shown a divergence since February (read that against the PerfCharts and RRG readings above). The volume itself is looking dangerously thin. Note the $54.25 support area where Volume by Price, the Ichimoku cloud, and the 50-day SME converge to provide support.
IRBO: The Third Man Hanging
This ETF owns shares in 118 different companies, making it the most diversified among the group. About half of these companies are in the US, but a good number of them are also in China and Japan. No single company represents more than 2% of the total investment. Some of the main companies in this fund are Spotify (SPOT), Meta Platforms (META), and Baidu (BIDU).
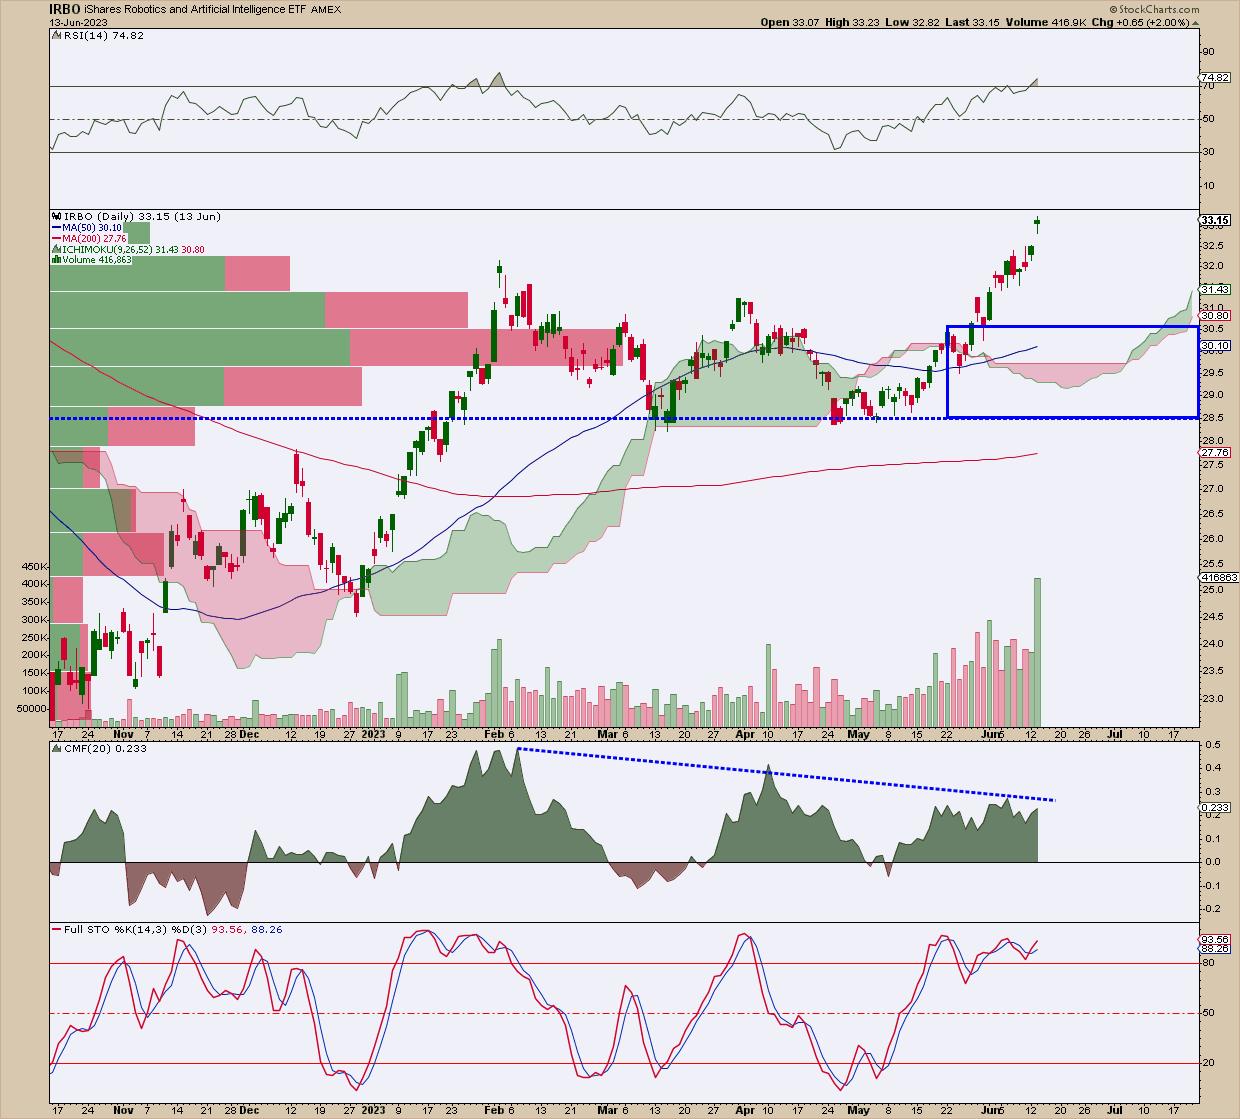
CHART 5: CLEAR SUPPORT LEVEL FOR IRBO. The price could pullback to anywhere between $25.50 and $30.50.Chart source: StockCharts.com (click chart for live version). For illustrative purposes only.
Similar to ROBO, IRBO's CMF divergence has also been pronounced since February. While $30.00 to $30.50 is an area of near-term support, the $29.50 level, which shows historical market-based support, gives a critical level. The next lower-string level of support might be at $25.50.
ARKQ: Runaway Gap
Cathie Wood's fund, ARKQ, puts money into 30 to 50 companies developing self-driving transportation, robots and automation, 3D printing, storing energy, and exploring space. 90%, or nearly all of the companies, are in the US. The fund's biggest investment is in Tesla (TSLA).
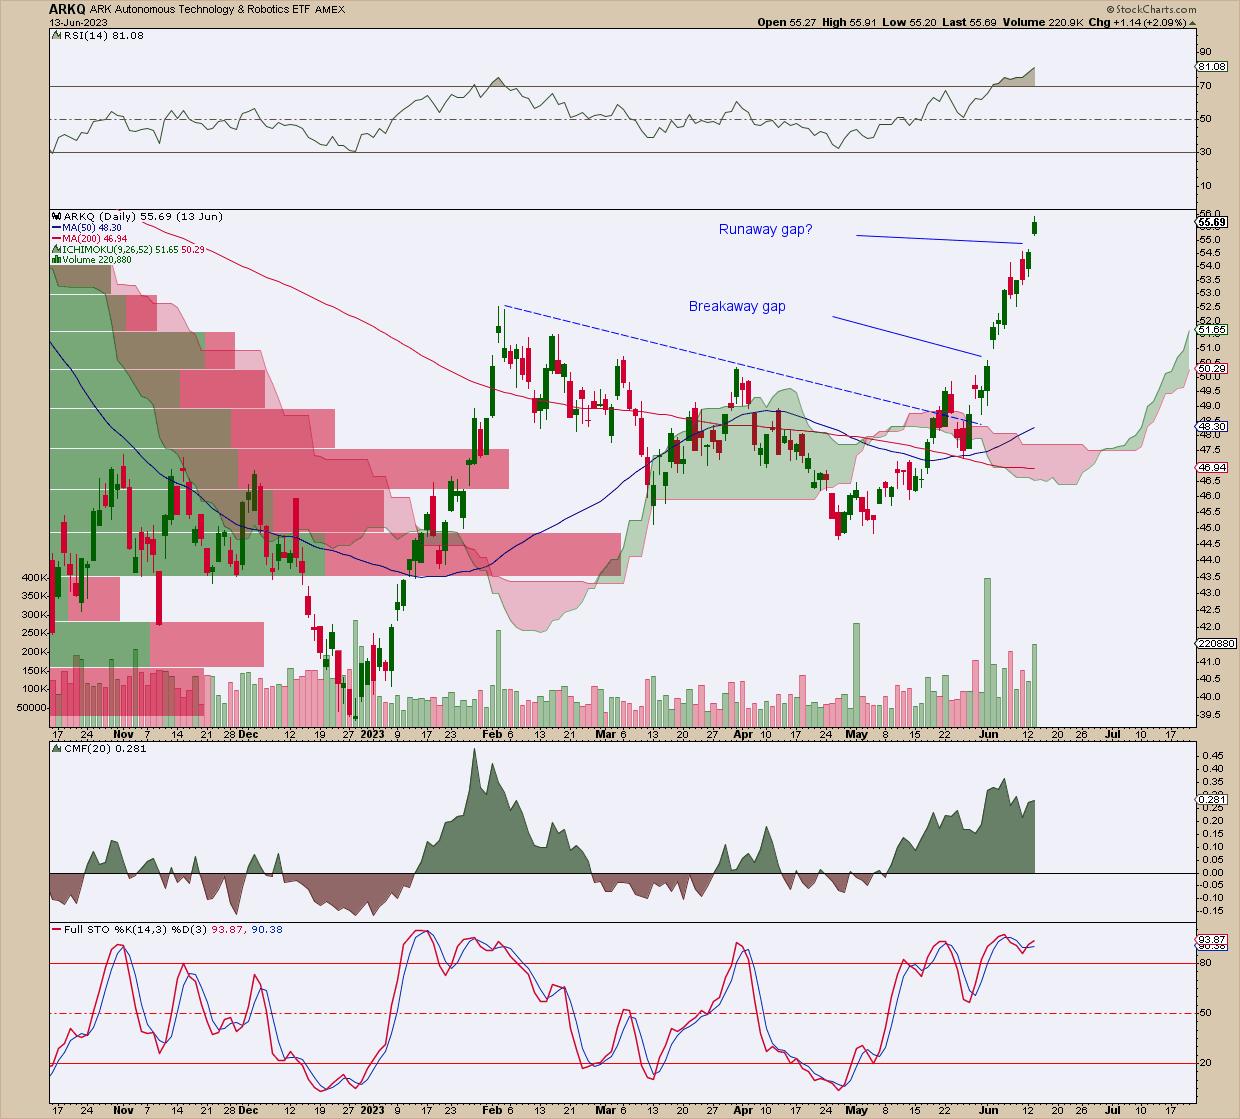
CHART 6: ARKQ'S BREAKAWAY GAP. The ETF could pull back to the $47 to $51 range.Chart source: StockCharts.com (click chart for live version). For illustrative purposes only.
Similar to the previous three examples, ARKQ is also in overbought territory, yet it does have a few differentiating features. First, the current candle looks like it's developing into a runaway gap (as opposed to the previous three's hanging man). Note that the current gap also follows a breakaway gap with strong volume that took place the previous week.
If price pulls back, there's likely to be a strong range of support from the $47-to-$51 range. If you recall the RRG illustration, ARKQ is the only ETF among the group that's indicating a turn toward strength.
The Bottom Line
All four AI ETFs appear to be due for a pullback, as all are giving us an overbought reading. You could wait for the pullback before deciding to open long positions. It all depends on the price action, especially at the support levels for these ETFs. Although the AI ETFs look overbought, it may be worth creating an AI ChartList that includes ETFs and individual AI-related stocks. And when you see clear entry signals, set your alerts. AI-related investments tend to move fast.

Disclaimer: This blog is for educational purposes only and should not be construed as financial advice. The ideas and strategies should never be used without first assessing your own personal and financial situation, or without consulting a financial professional.
Happy charting!


