TAKEAWAYS
- Tech stocks took a dive on Wednesday but look like they are making up some of those losses prior to hitting the next support level.
- Expect volatility in the stock market in the coming weeks since it's earnings season and there's a Fed meeting next week.
- Keep an eye on small-cap stocks since they could outperform large-cap stocks in the coming weeks.

Wednesday's price action in the stock market indicated that fear is back. The Cboe Volatility Index ($VIX) closed up by over 22%, the biggest percentage move for the year. There's a chance volatility could remain elevated for the near term—it's the middle of earnings season, the November election landscape has changed, and it's a seasonally weak period for equities.
On Wednesday, the S&P 500 ($SPX) and Nasdaq Composite ($COMPQ) experienced the worst trading day of the year. The Nasdaq Composite was hit hard, closing lower by 3.64%. From a big-picture point of view, how much damage did the drop do? Let's look closely at the price action in the Nasdaq Composite, starting with the weekly chart.
The Macro View of the Nasdaq
Looking at a five-year weekly chart below, the uptrend that commenced in October 2023 is still in play. The moving averages overlaid on the chart are adjusted to reflect support levels for the uptrend since October 2023. The short-term uptrend followed the eight-week exponential moving average (EMA). In April 2024, the Nasdaq Composite bounced off the 25-week simple moving average (SMA), and in October, the index bounced off its 48-week SMA.
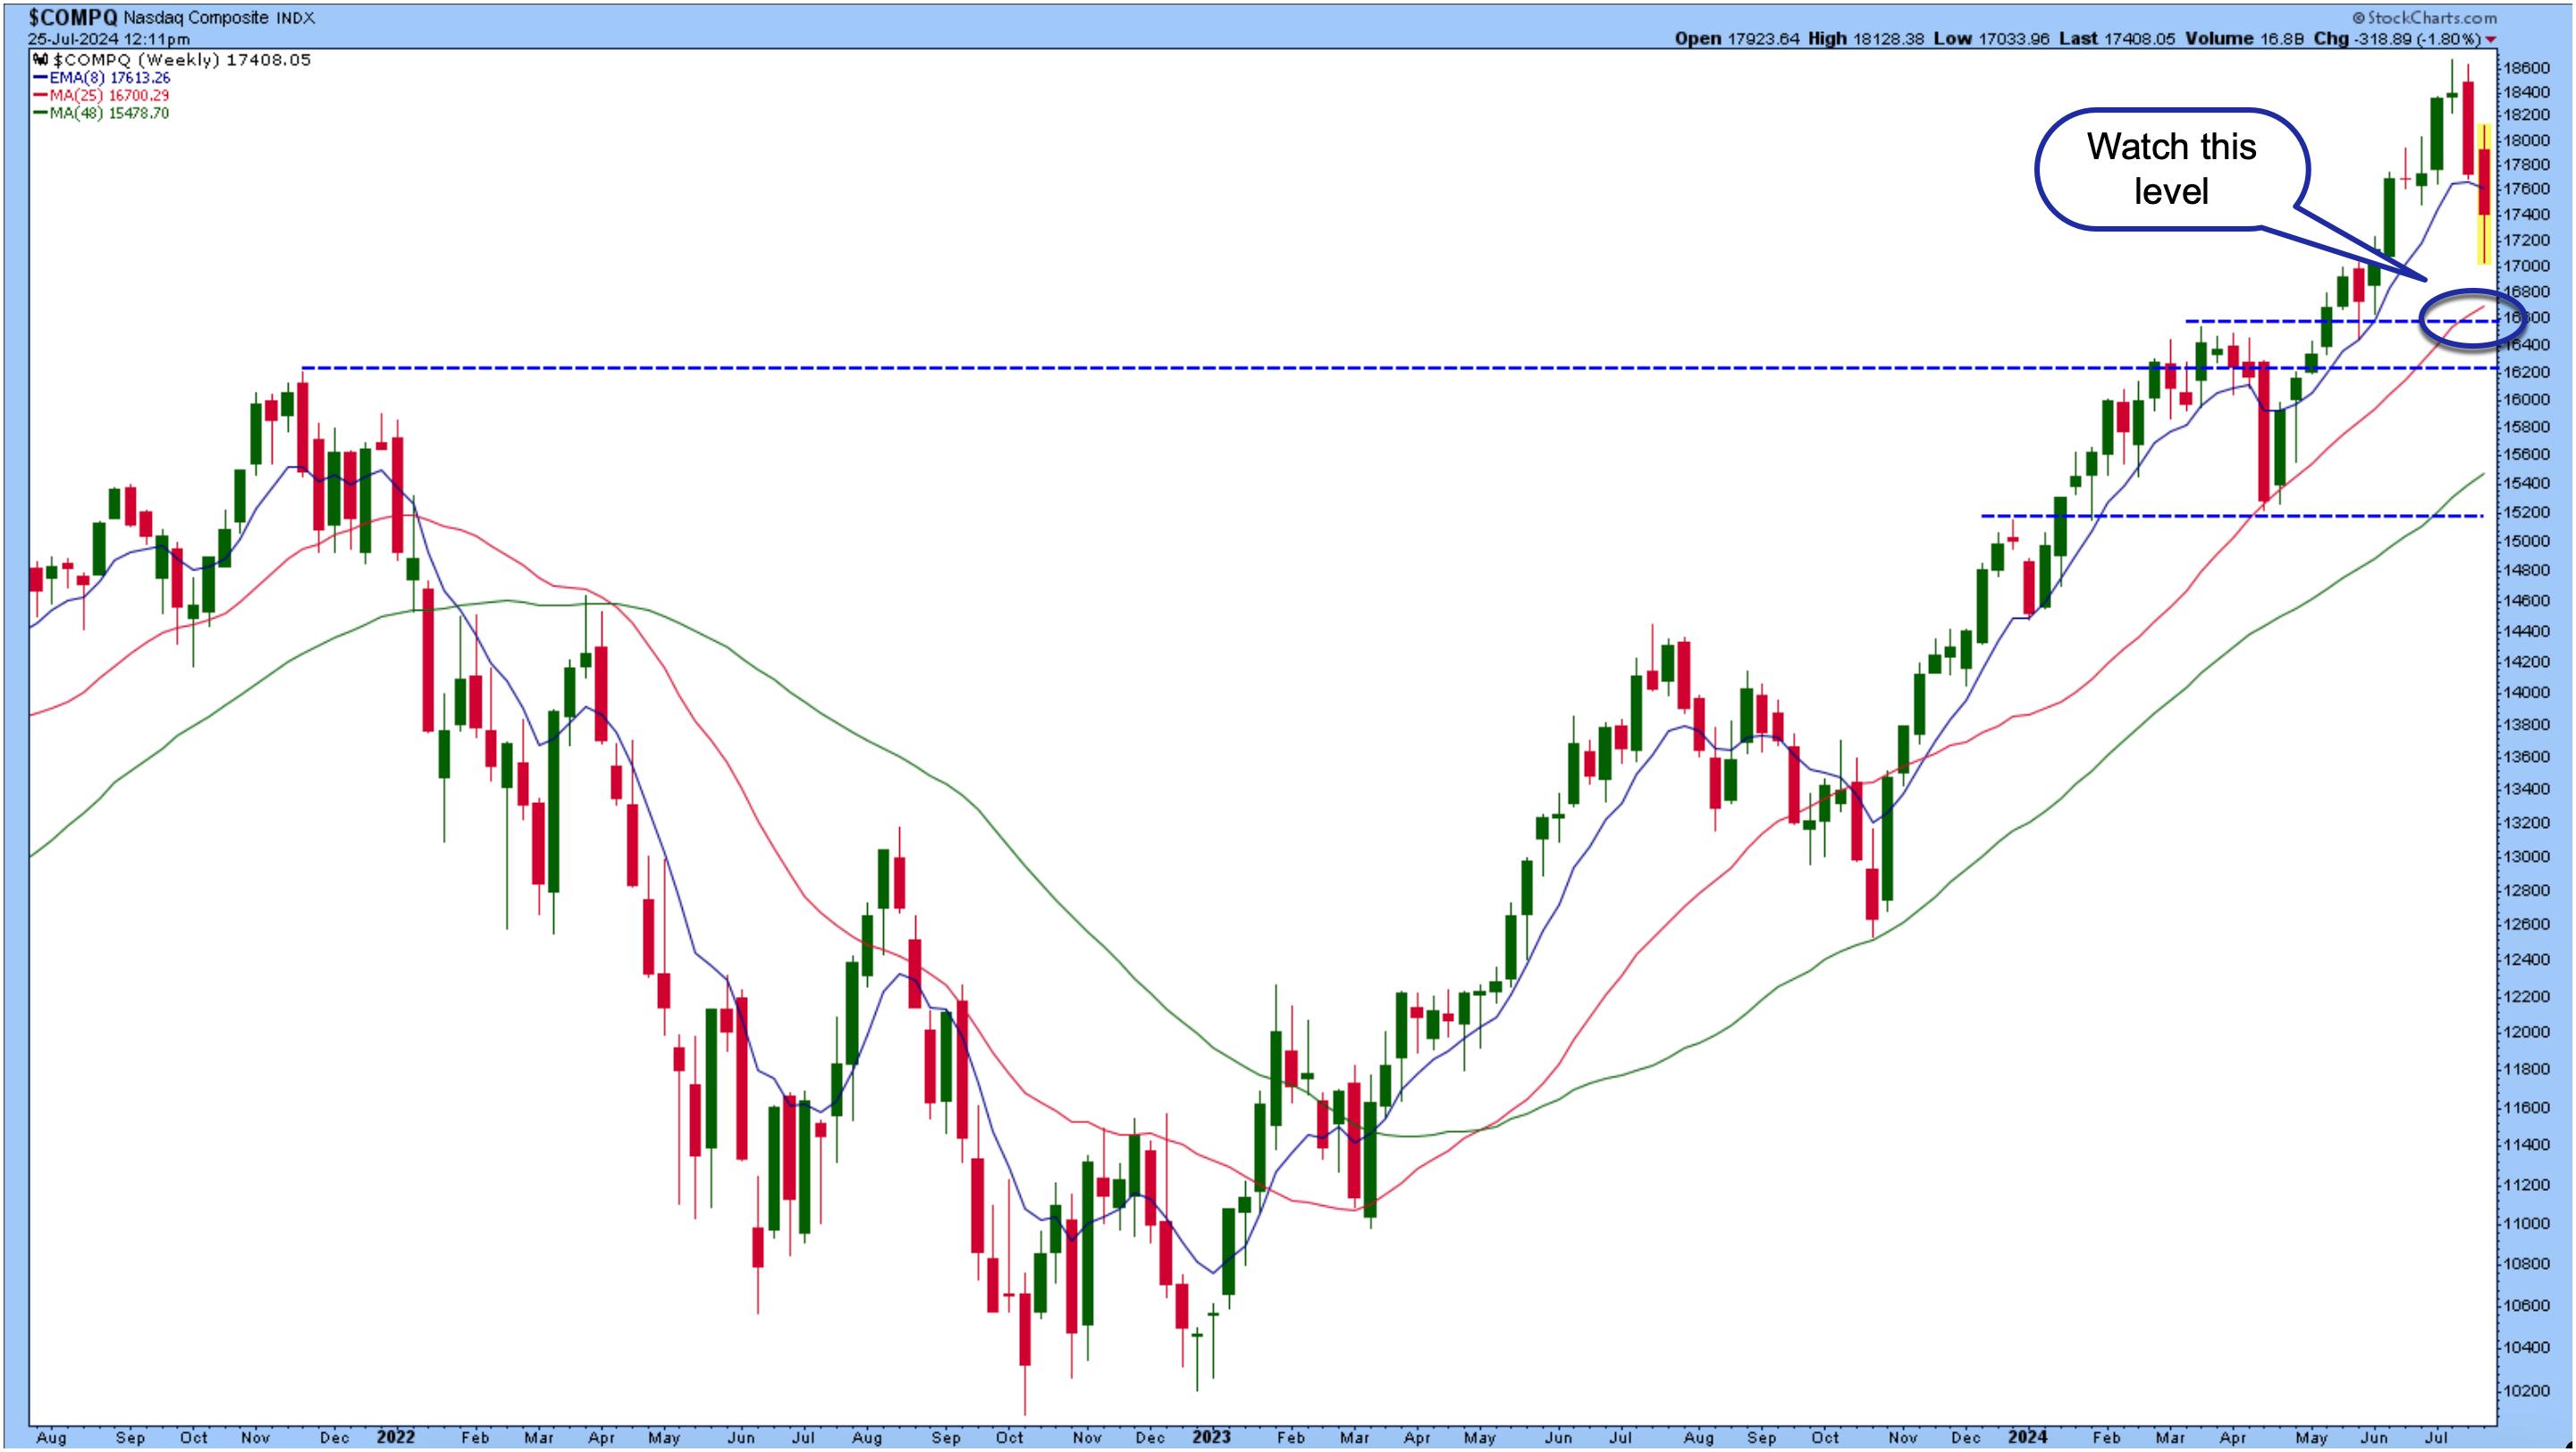
CHART 1. WEEKLY CHART OF NASDAQ COMPOSITE. Will the Nasdaq find support at its 25-week moving average? Chart source: StockCharts.com. For educational purposes.
On Wednesday, the Nasdaq Composite broke below its eight-week EMA, the first alarm bell indicating that things may not be great in AI land. The following day, the selloff continued in the early part of the trading day but recovered some losses.
If the selloff continues, the next point to watch would be the 25-week SMA which corresponds closely with the support of the last previous weekly high. Will the Nasdaq bounce off this level similar to what it did in April or will it continue lower and bounce off its 48-week SMA like it did in October? Or will the Nasdaq honor the support level of previous highs and lows (blue dashed lines)?
Any of the scenarios could play out, or, as is characteristic of the stock market, it could do something unique.
A Shorter-Term View of the Nasdaq
Let's turn to the daily chart (see chart below) to zero in on that first support level on the weekly chart, 16,670. To hit that level, the Nasdaq Composite will have to fall between the 100-day SMA and the 61.8% Fibonacci retracement level. You can see from the chart that the Nasdaq approached its 50% Fib retracement level but reversed and moved back up to the 38.2% retracement level.
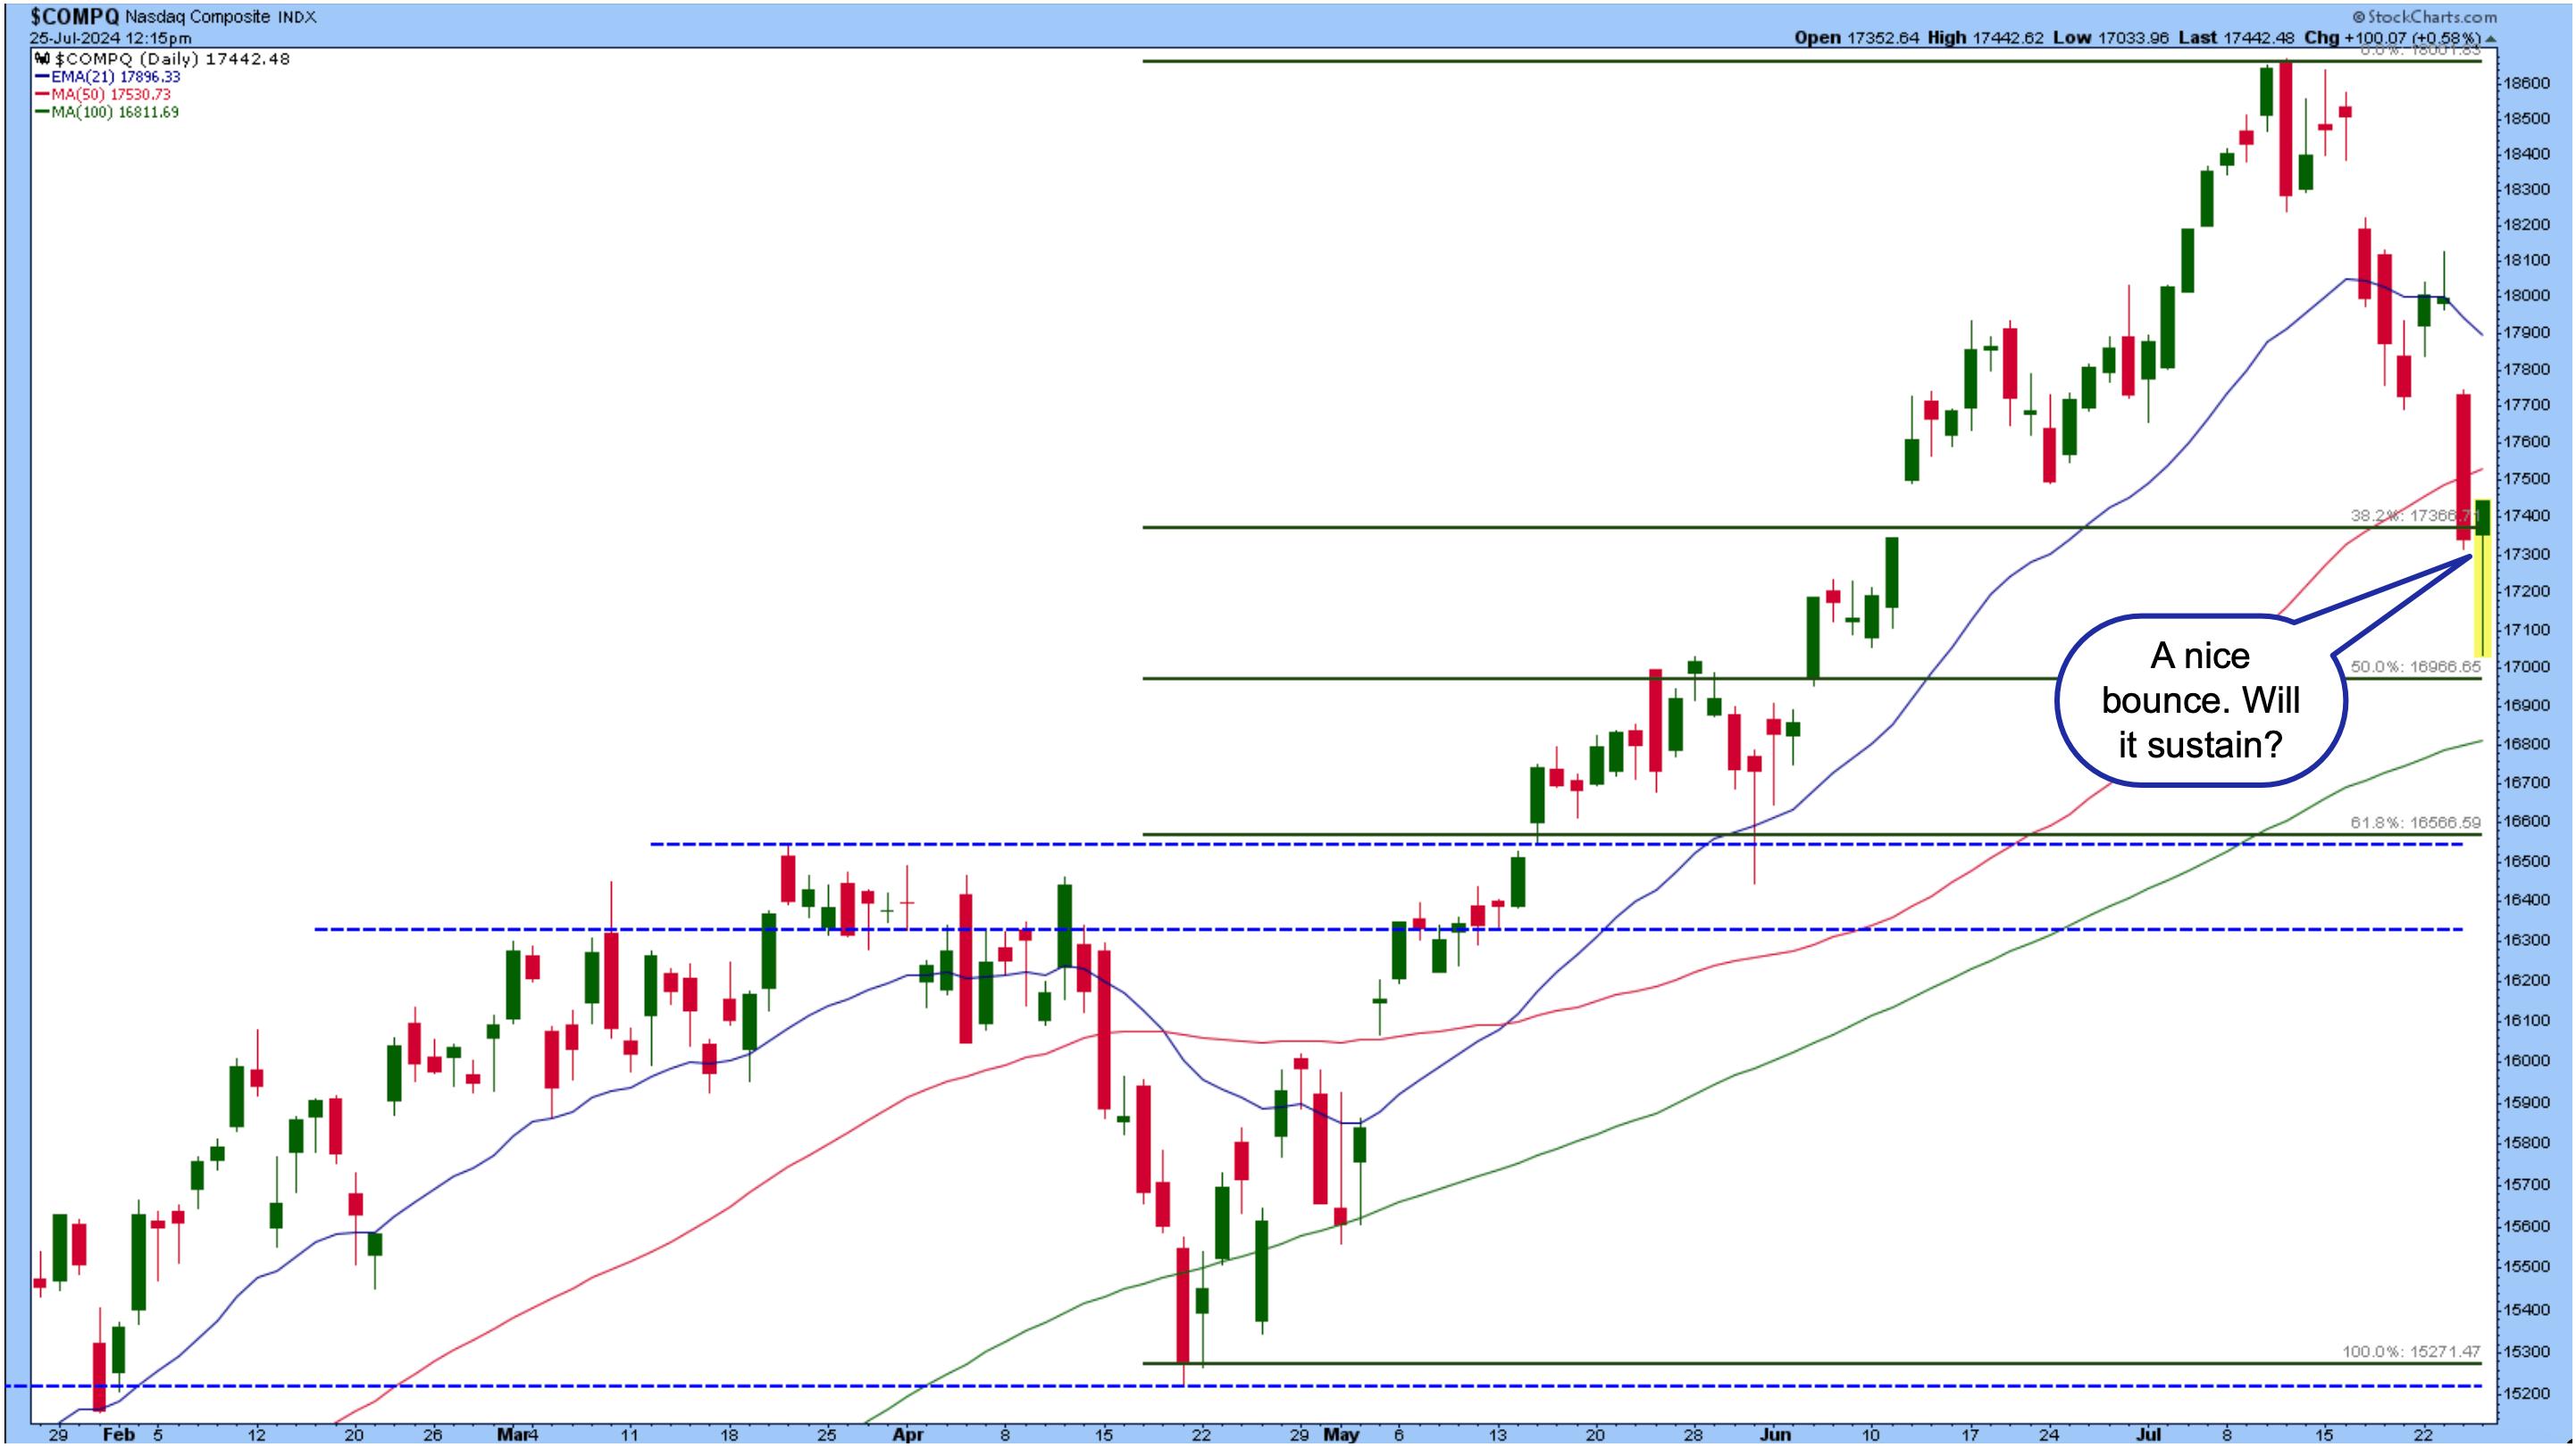
CHART 2. DAILY CHART OF NASDAQ COMPOSITE. The index recovered. The question is, will it sustain? Chart source: StockCharts.com. For educational purposes.
If VIX remains elevated, expect more sizable movements in the Nasdaq and other equity indexes. The Personal Consumption Expenditure (PCE) for June drops on Friday.
Earnings Volatility
Earnings had a lot to do with this week's price action. Alphabet (GOOGL) and Tesla (TSLA) reported on Tuesday after the close. Even though GOOGL beat earnings expectations, the decline in YouTube revenues led investors to sell the stock. TSLA earnings missed estimates, with the stock closing lower by 12.33%.
Next week, we'll hear from more Mag 7 companies. Given that investors are getting jittery about tech stocks, the companies have to produce incredibly strong earnings reports. Even one negative report can send the stock price and the entire stock market lower.
Assuming that equities fall further—it's a fair assumption given that a correction is expected—what kind of investment strategy should you apply? Your first thought may be bonds, but they're not showing signs of strength. Bond prices fell on Wednesday along with stocks. Commodities and cryptocurrencies aren't showing signs of enthusiasm either.
Small-Cap Stocks
Small-cap stocks are outperforming large-cap stocks, as displayed in the chart of the ratio between iShares Russell 2000 ETF (IWM) and the SPDR S&P 500 ETF (SPY) below. Compare the price action to what occurred between December 2023 and January 2024. The S&P chart in the lower panel doesn't show a sizable correction during that period. But no two periods are alike so it's best to keep a close watch on the different moving parts of the stock market.
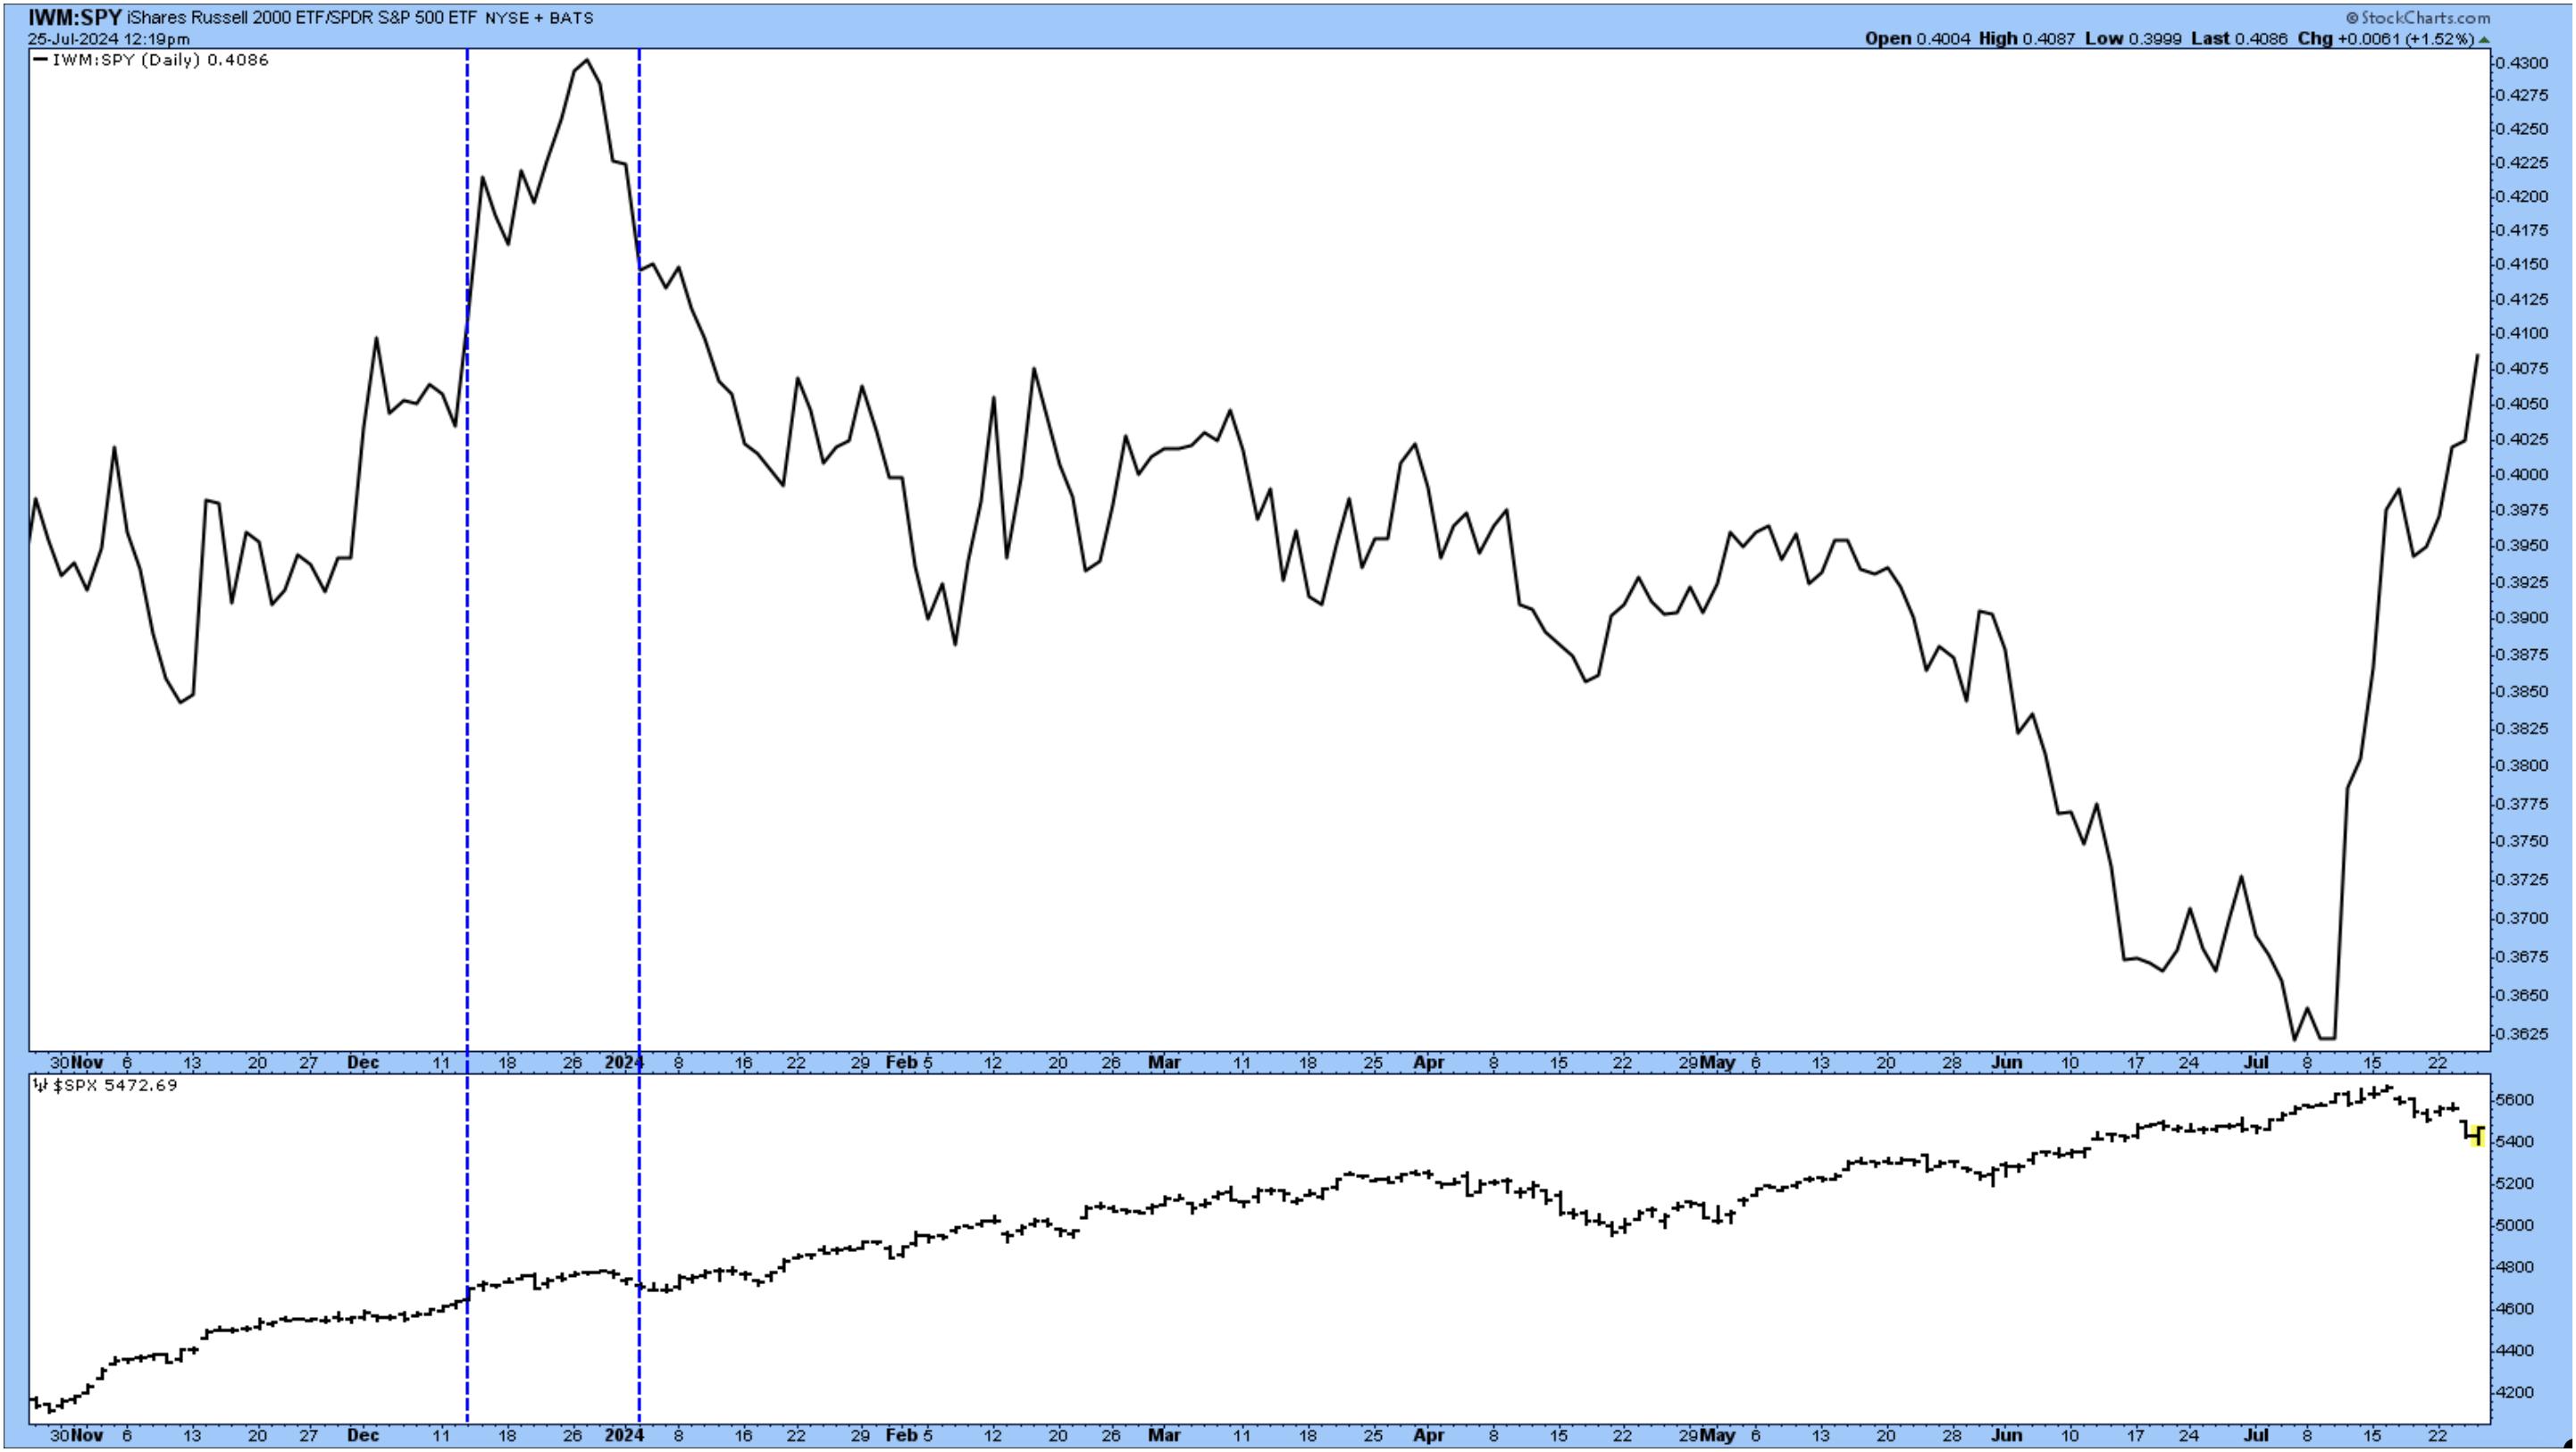
CHART 3. SMALL CAPS VS. LARGE CAPS. Small caps are outperforming large-cap stocks, although it doesn't necessarily mean that large caps will pull back significantly. It's still worth watching this chart. Chart source: StockCharts.com. For educational purposes.
IWM is made up of small-cap US stocks. Interestingly, one of the top holdings in IWM is Insmed Inc. (INSM), a stock with a high StockCharts Technical Rank (SCTR) score. It also has an interesting chart pattern (see chart below).
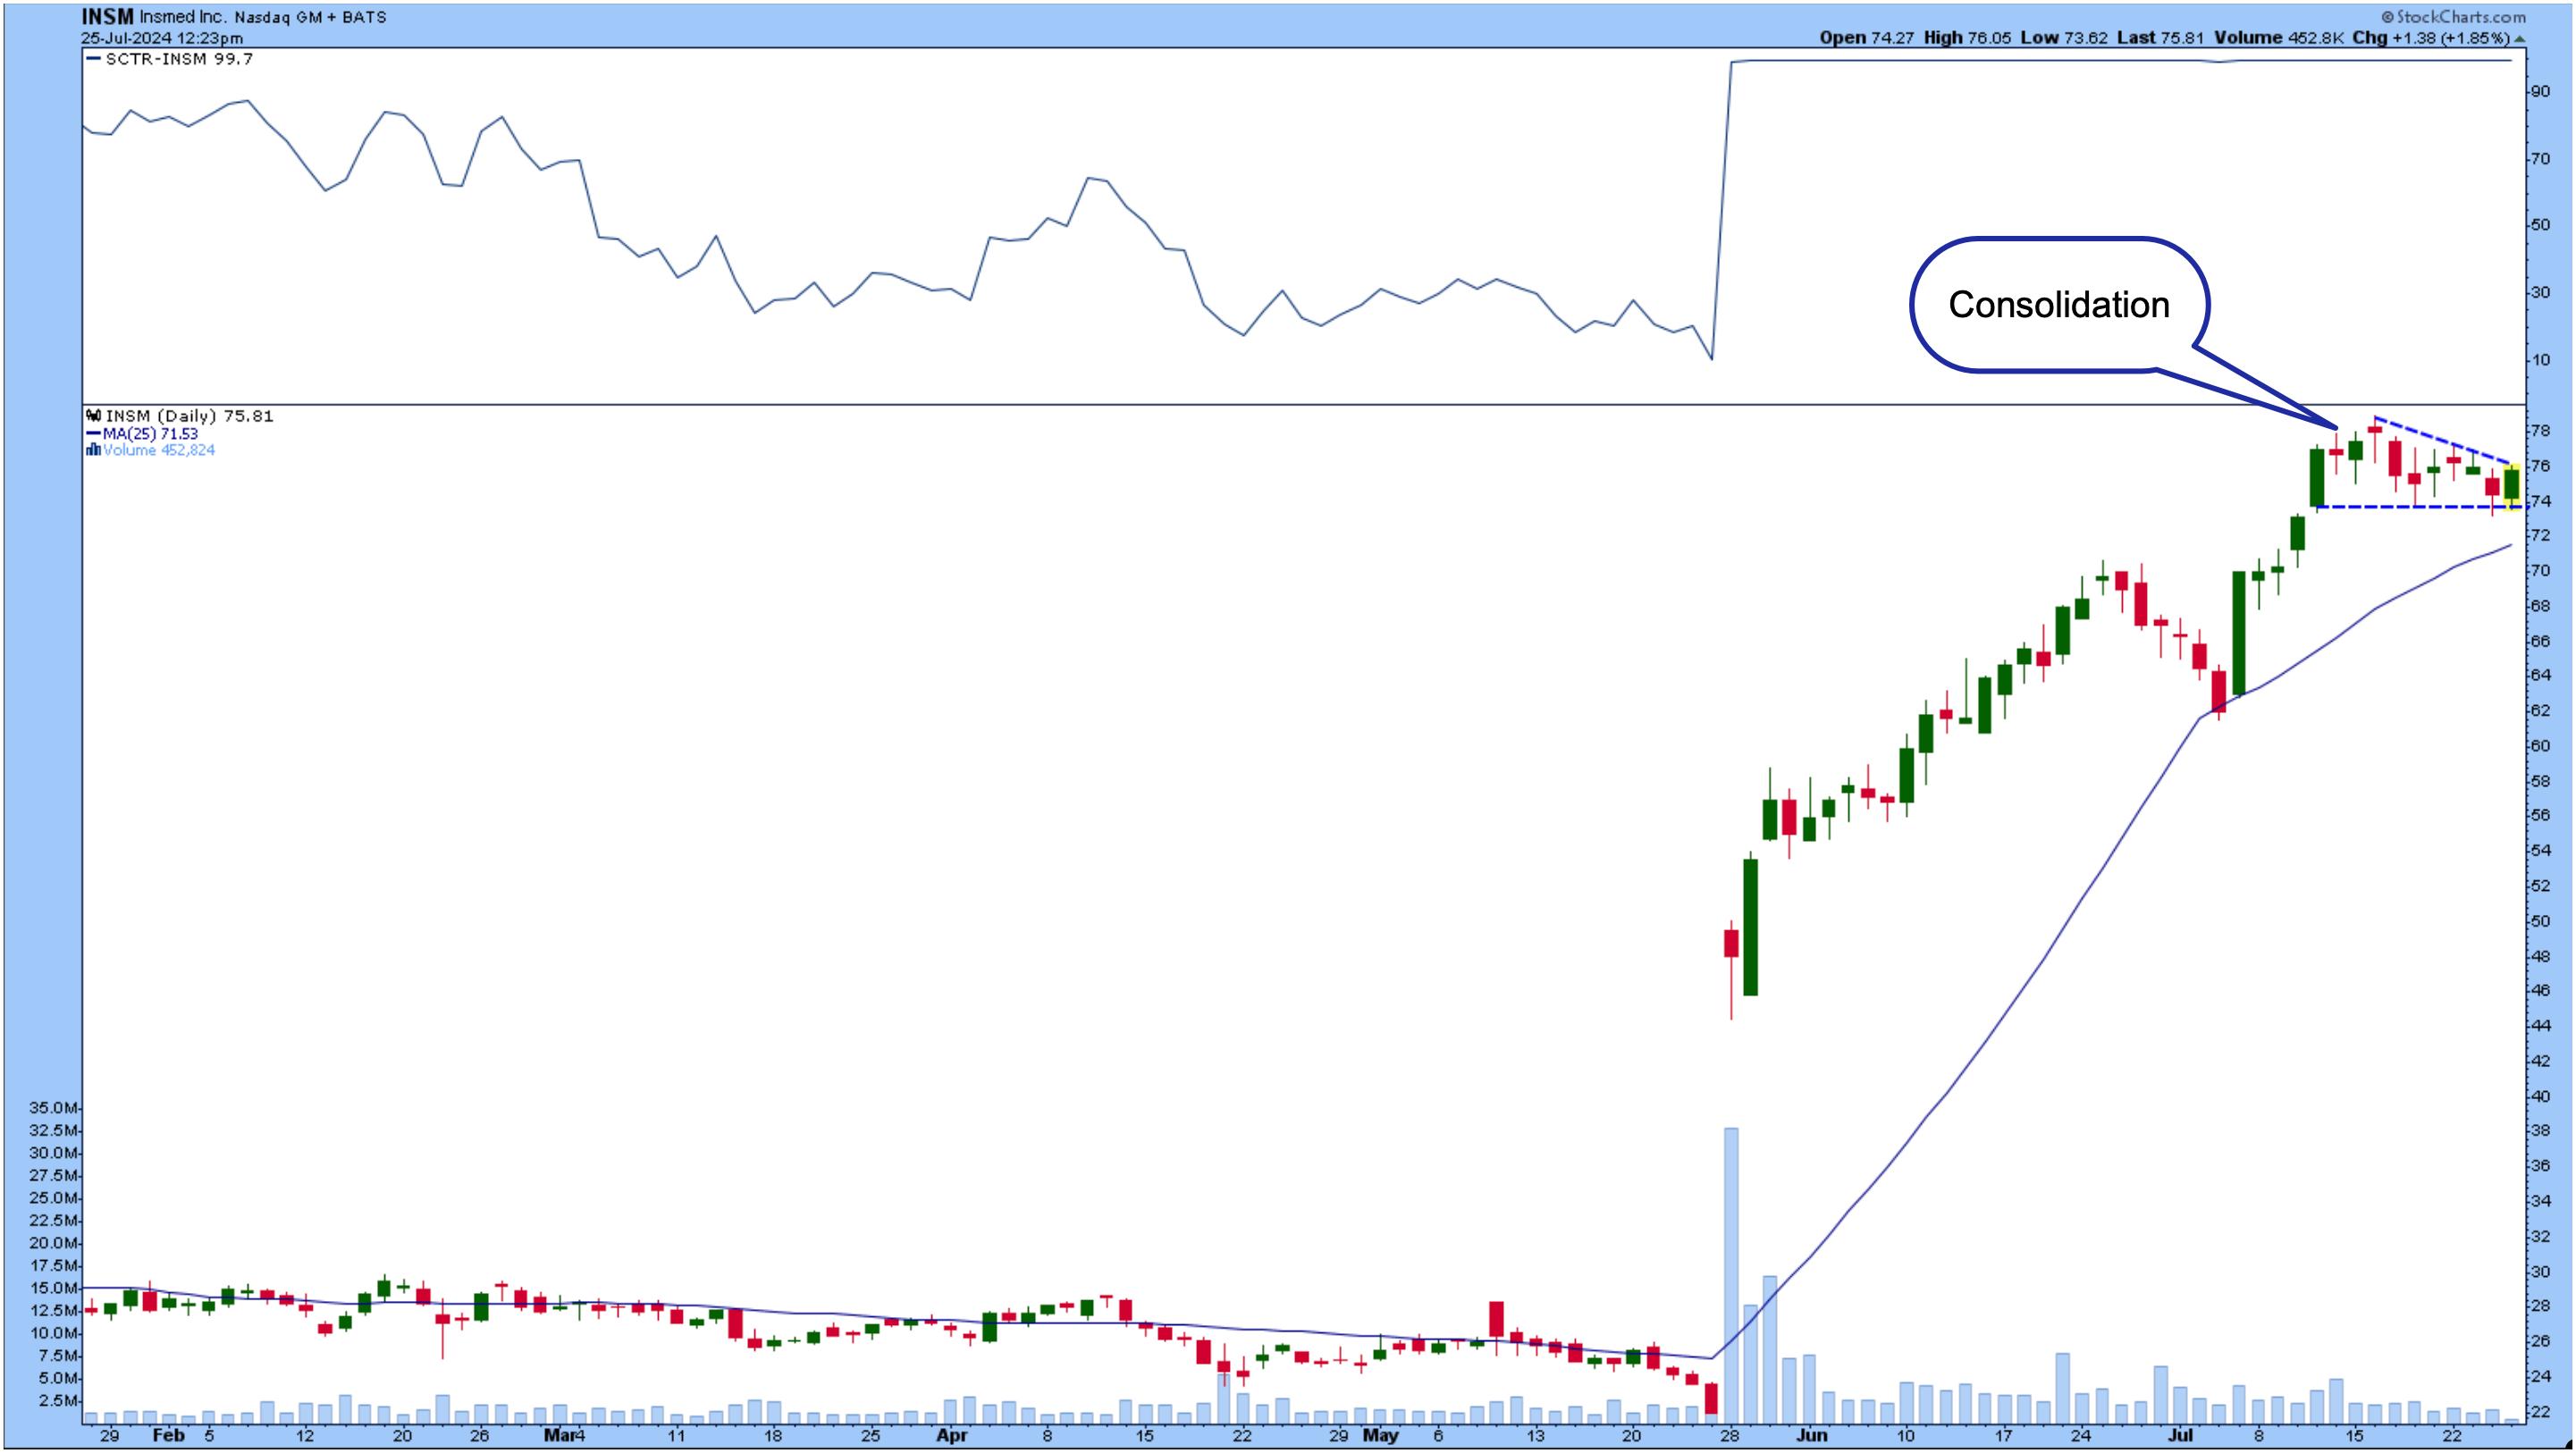
CHART 4. DAILY CHART OF INSMED INC. (INSM). The chart gapped about its previous all-time high in 2021 and is now consolidating. With a strong SCTR score, will the stock maintain its strong position? Chart source: StockCharts.com. For educational purposes.
The stock price gapped up above its February 2021 all-time high and has continued moving higher. It's now consolidating. Watch for the stock to break out above the descending triangle pattern (blue dashed lines) or to reach the support of its 25-day SMA. An upside follow-through from either of these patterns could make this a strong trading candidate. So, set your alerts on StockCharts so you don't miss this one.
You could do a similar analysis on other top IWM holdings, such as FTAI Aviation Ltd. (FTAI), Vaxcyte Inc. (PCVX), and Sprouts Farmers Market Inc. (SFM).
Other Market Segments To Consider
Other areas of the market worth considering are value stocks. Bring up a ratio chart of the iShares Russell 1000 Value ETF (IWD) to the iShares Russell 1000 Growth ETF (IWF).
Regional banks are also performing well. Bring up a chart of the SPDR S&P Regional Banking ETF (KRE). If this catches your attention, head to the StockCharts Symbol Summary page, type in KRE, and start your research. The Profile section has a link to the ETF page from where you can find the top holdings.
Closing Position
If volatile conditions persist in the market for the next month or so, you'll need to develop a strategy to manage your portfolio to cushion your drawdowns. Next week there are more earnings and a Fed meeting. So, be prepared with your game plan.

Disclaimer: This blog is for educational purposes only and should not be construed as financial advice. The ideas and strategies should never be used without first assessing your own personal and financial situation, or without consulting a financial professional.
Happy charting!


