TAKEAWAYS
- After two days of massive selloffs, Friday's recovery offers some hope.
- Investors await earnings from mega-cap tech companies, economic data, and Fed meeting.
- Small caps continue to trend higher.

Major equity indexes rose on Friday after a selloff that hit the Technology sector especially hard. But this doesn't necessarily mean that everything is OK going into next week. Wall Street seems to be in whiplash land, veering from one market area to another.
The Dow Jones Industrial Average ($INDU) closed higher by 1.64%, providing a boost to Industrials. The Nasdaq Composite ($COMPQ) and S&P 500 ($SPX) closed mid-range. That all indexes closed above their Thursday lows is encouraging and a good way to end a week that looked like it could end in doom.
Softer Inflation Data Sheds Optimism
It's possible the June Personal Consumption Expenditure (PCE) price index was the catalyst behind the recovery rally. The PCE rose 0.1% month over month and 2.5% year over year. The core CPI rose 0.2% month over month and 2.6% year over year. The data suggests that inflation is slowly converging toward the Fed's 2.0% target. So, perhaps the soft landing scenario will become a reality. Let's wait to hear what Fed Chair Powell says next week.
The S&P 500 bounced off the 50-day simple moving average (SMA) and touched the October–April trendline at its high but closed lower (see chart below). Will the trendline act as a strong support level for the index to conquer?
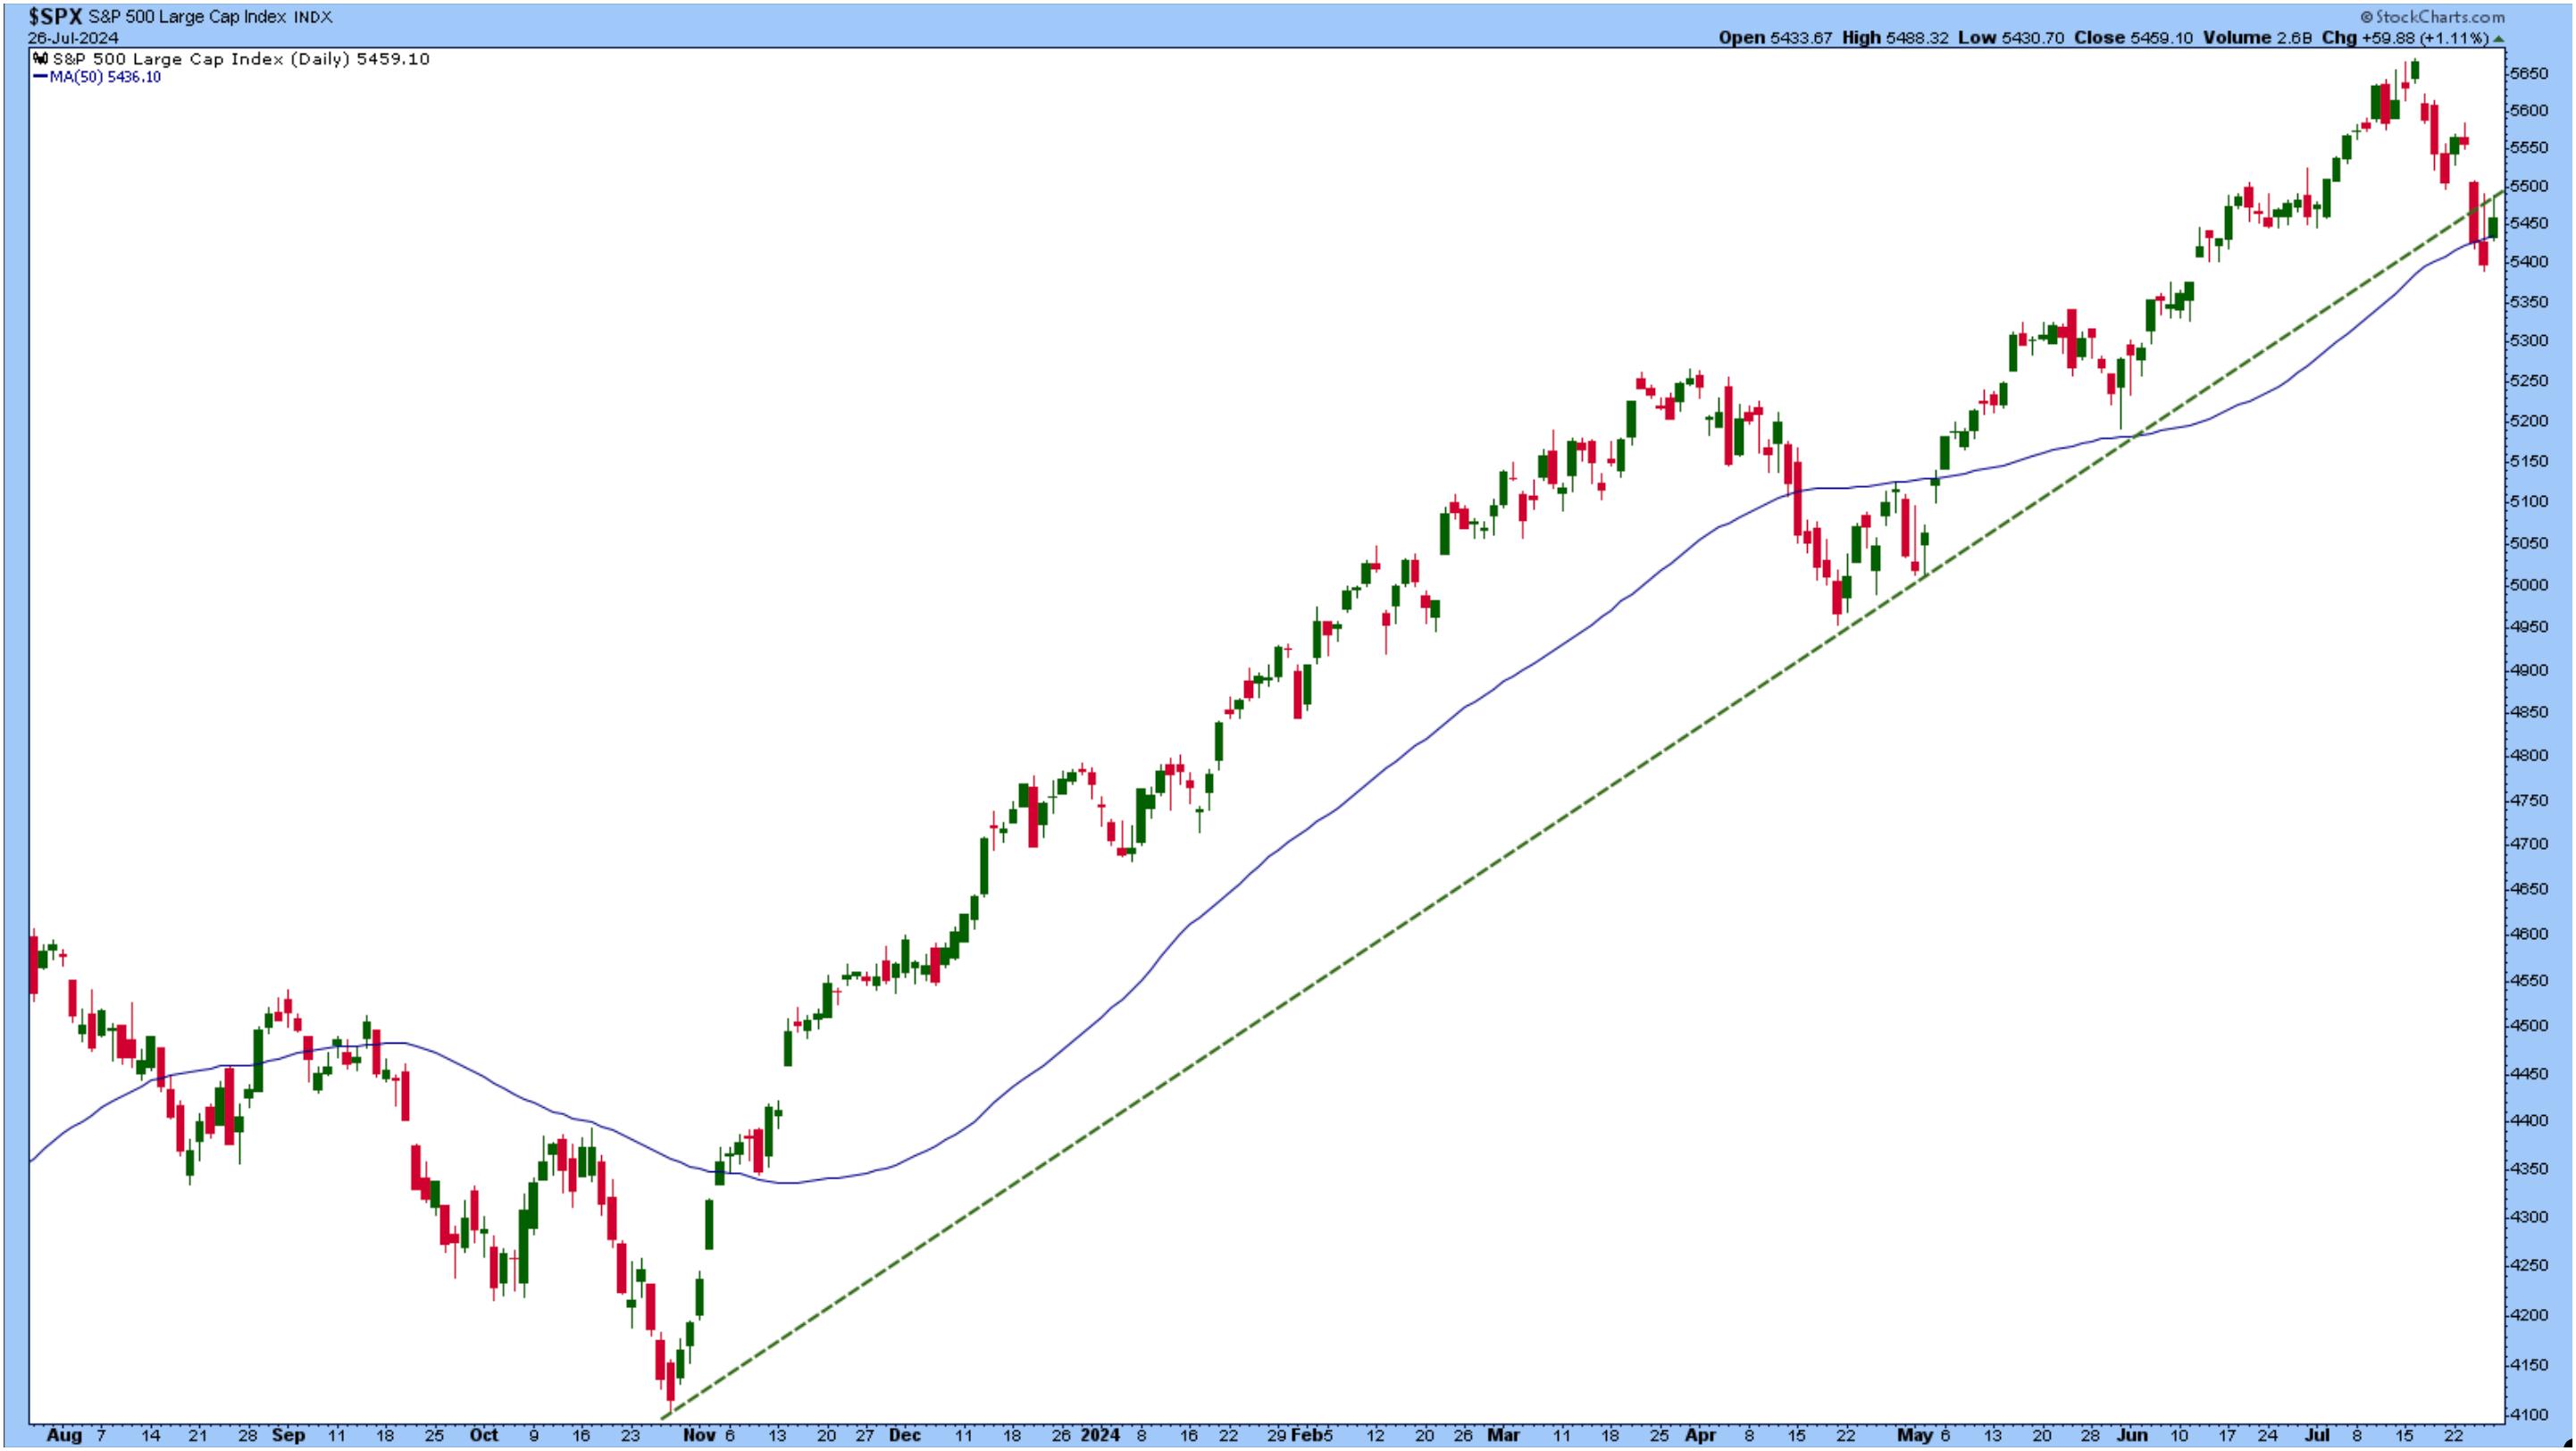
CHART 1. UPTREND IN THE S&P 500 SINCE OCTOBER 2023. The S&P 500 is in an important area, and investors should watch to see if it breaks above or below the trendline or moving average. Chart source: StockCharts.com. For educational purposes.
The long-term trend is still looking strong, but given that the next few months is a seasonally weak period, expect the market to correct. As long as it stays above its 25-week SMA and the SMA is trending higher, the long-term trend will be bullish.
The Nasdaq was hard hit on Wednesday and Thursday, and Friday's recovery didn't take the index above its 50-day SMA (see chart below). It's still looking indecisive as it straddles below the 38.2% Fibonacci retracement level (see chart below).
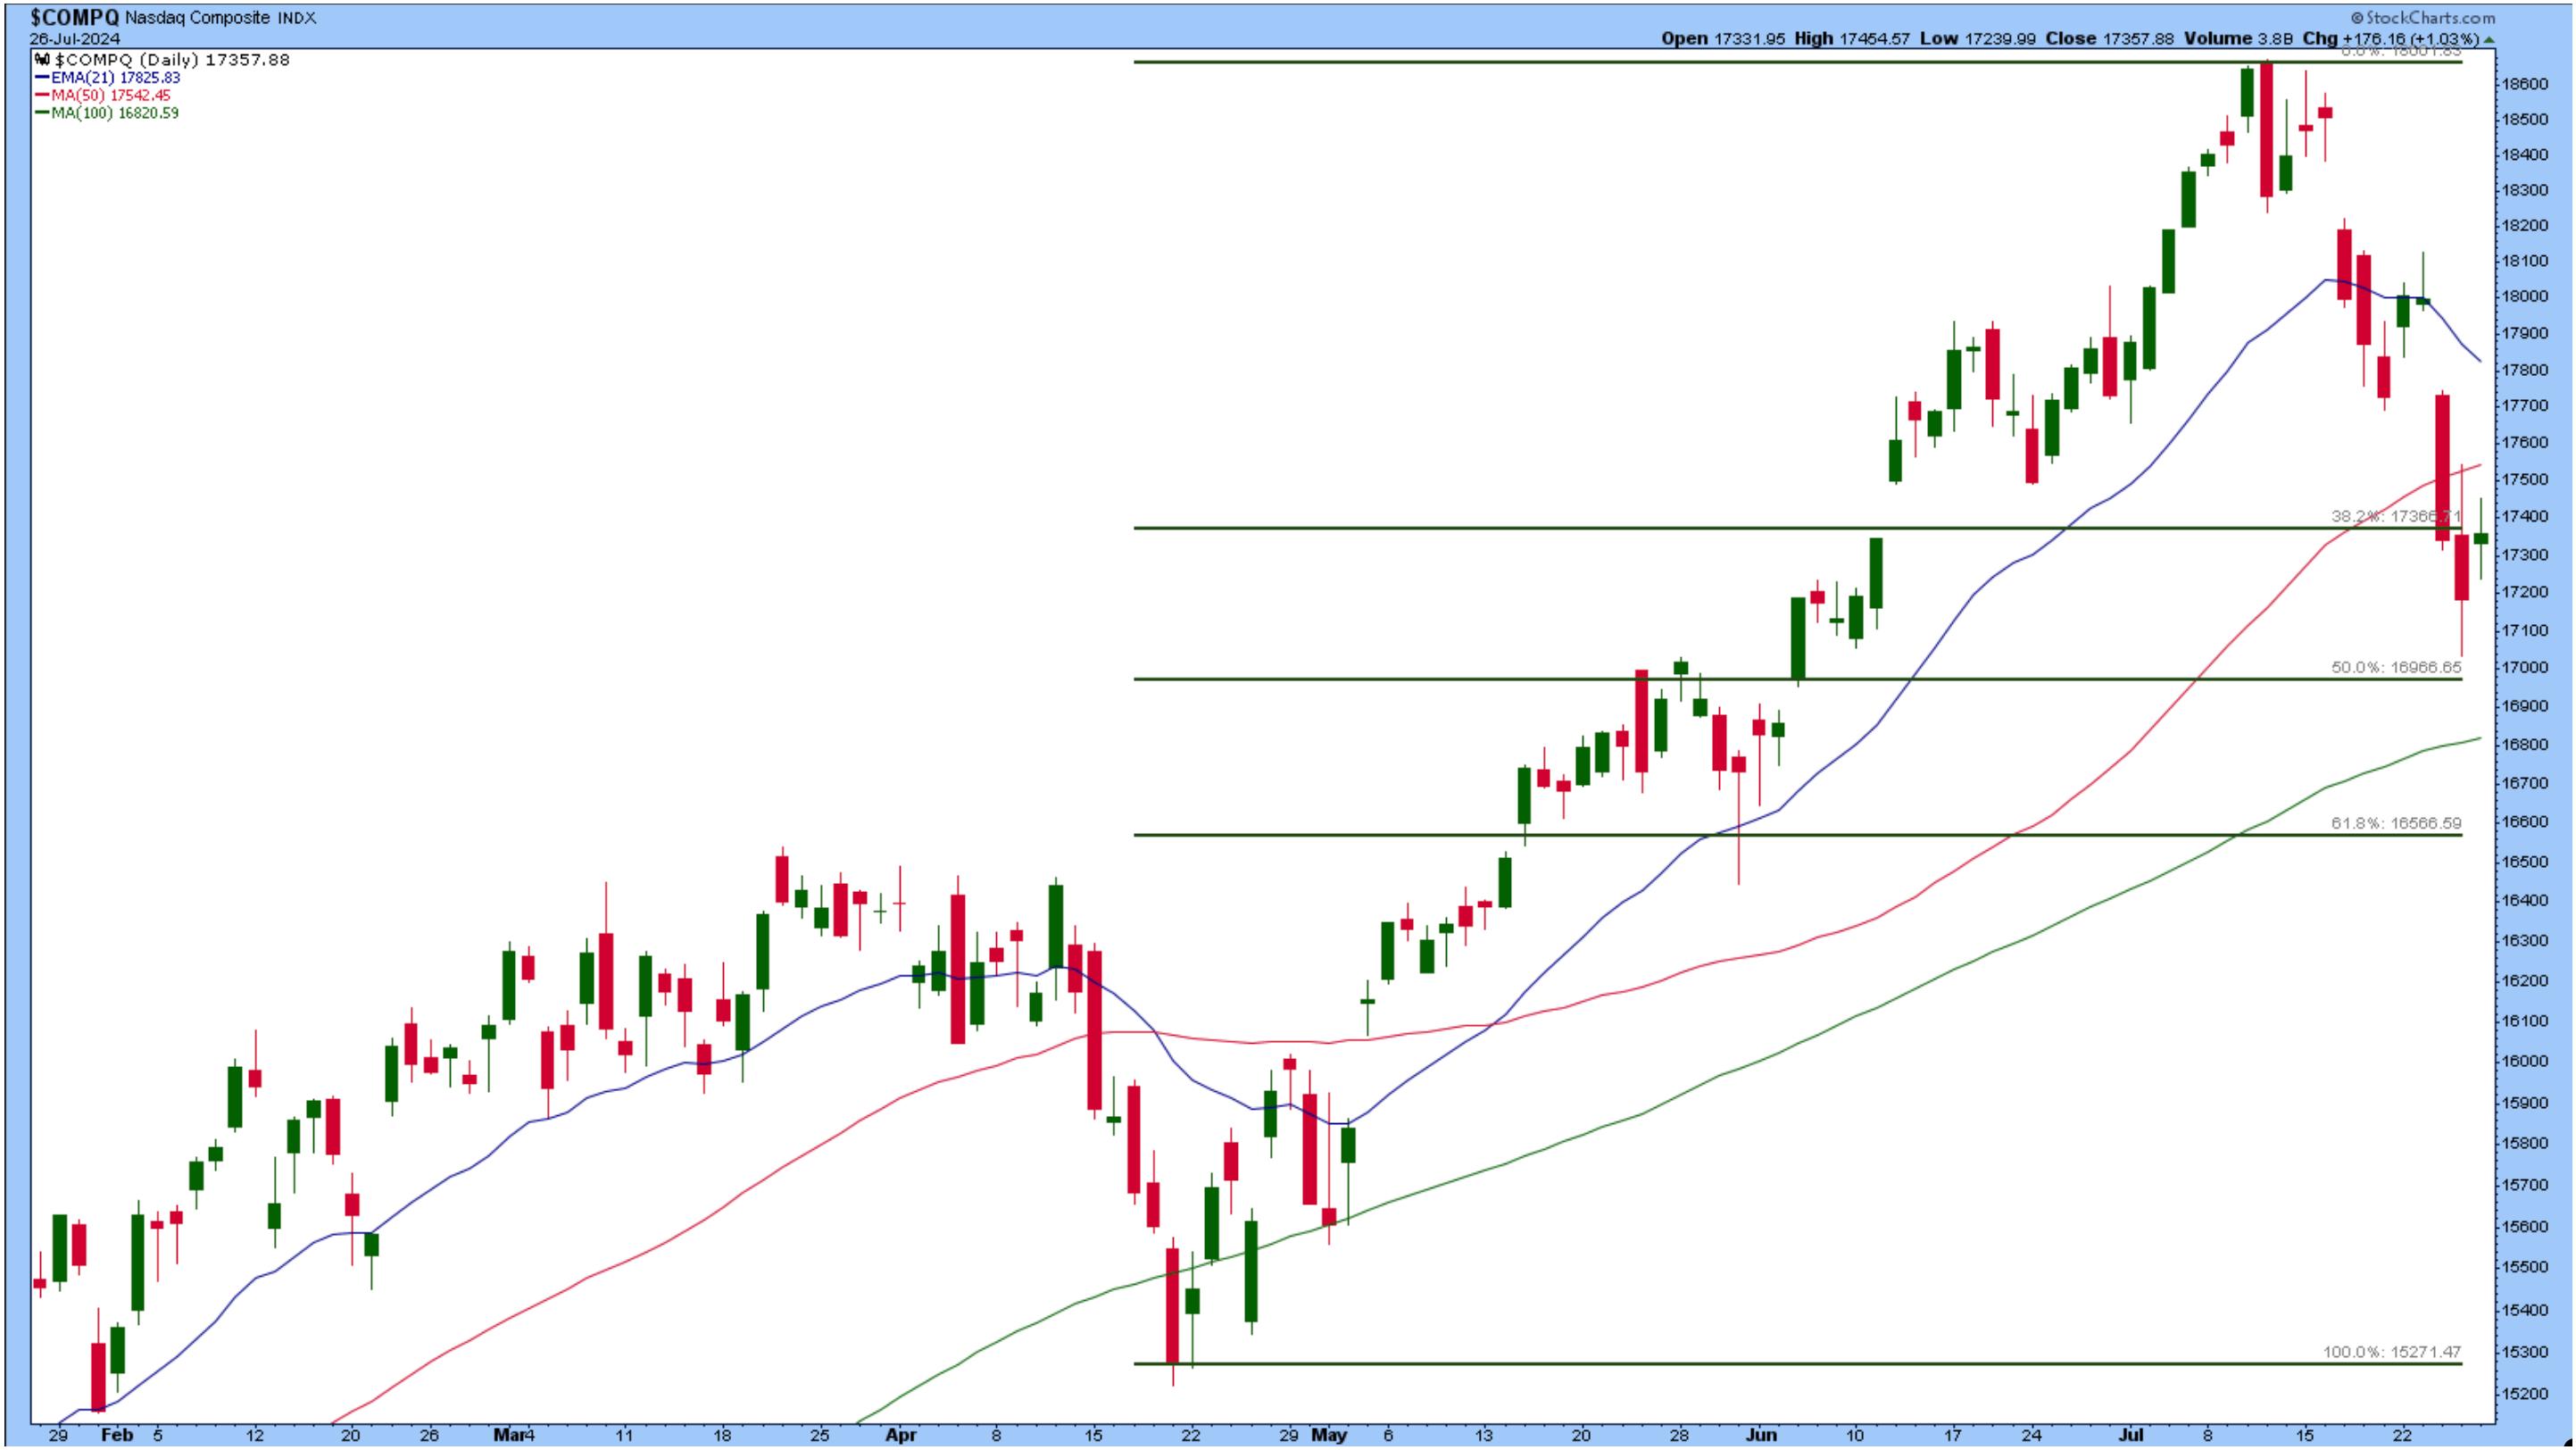
CHART 2. DAILY CHART OF NASDAQ COMPOSITE WITH FIBONACCI RETRACEMENT LEVELS. The Nasdaq failed to break above its 38.2% Fibonacci retracement level. Let's see what next week brings. Chart source: StockCharts.com. For educational purposes.
Where Are Investors Flocking?
The Dow Jones Industrial Average, which got hit hard after hitting a new high on July 17, was the big winner on Friday. And since the S&P 400 midcap index has a high concentration of Industrials, the S&P 500 Mid Cap Index ($MID) got a boost.
Small-cap stocks also rose, with the S&P 600 Small Cap Index ($SML) hitting a new 52-week high. Does this mean that undervalued small caps are a good place to park your cash while the mega-cap indexes go through their correction? It may be worth considering, given that most of the big tech companies reporting next week are looking weak technically.
So, what's going well? The cooling inflation data increased expectations of interest rate cuts which helped bank stocks. While the broader equity indexes were struggling, the KBW Bank Index ($BKX) saw a mild correction followed by a rally (see chart below). The index closed at a new 52-week high.
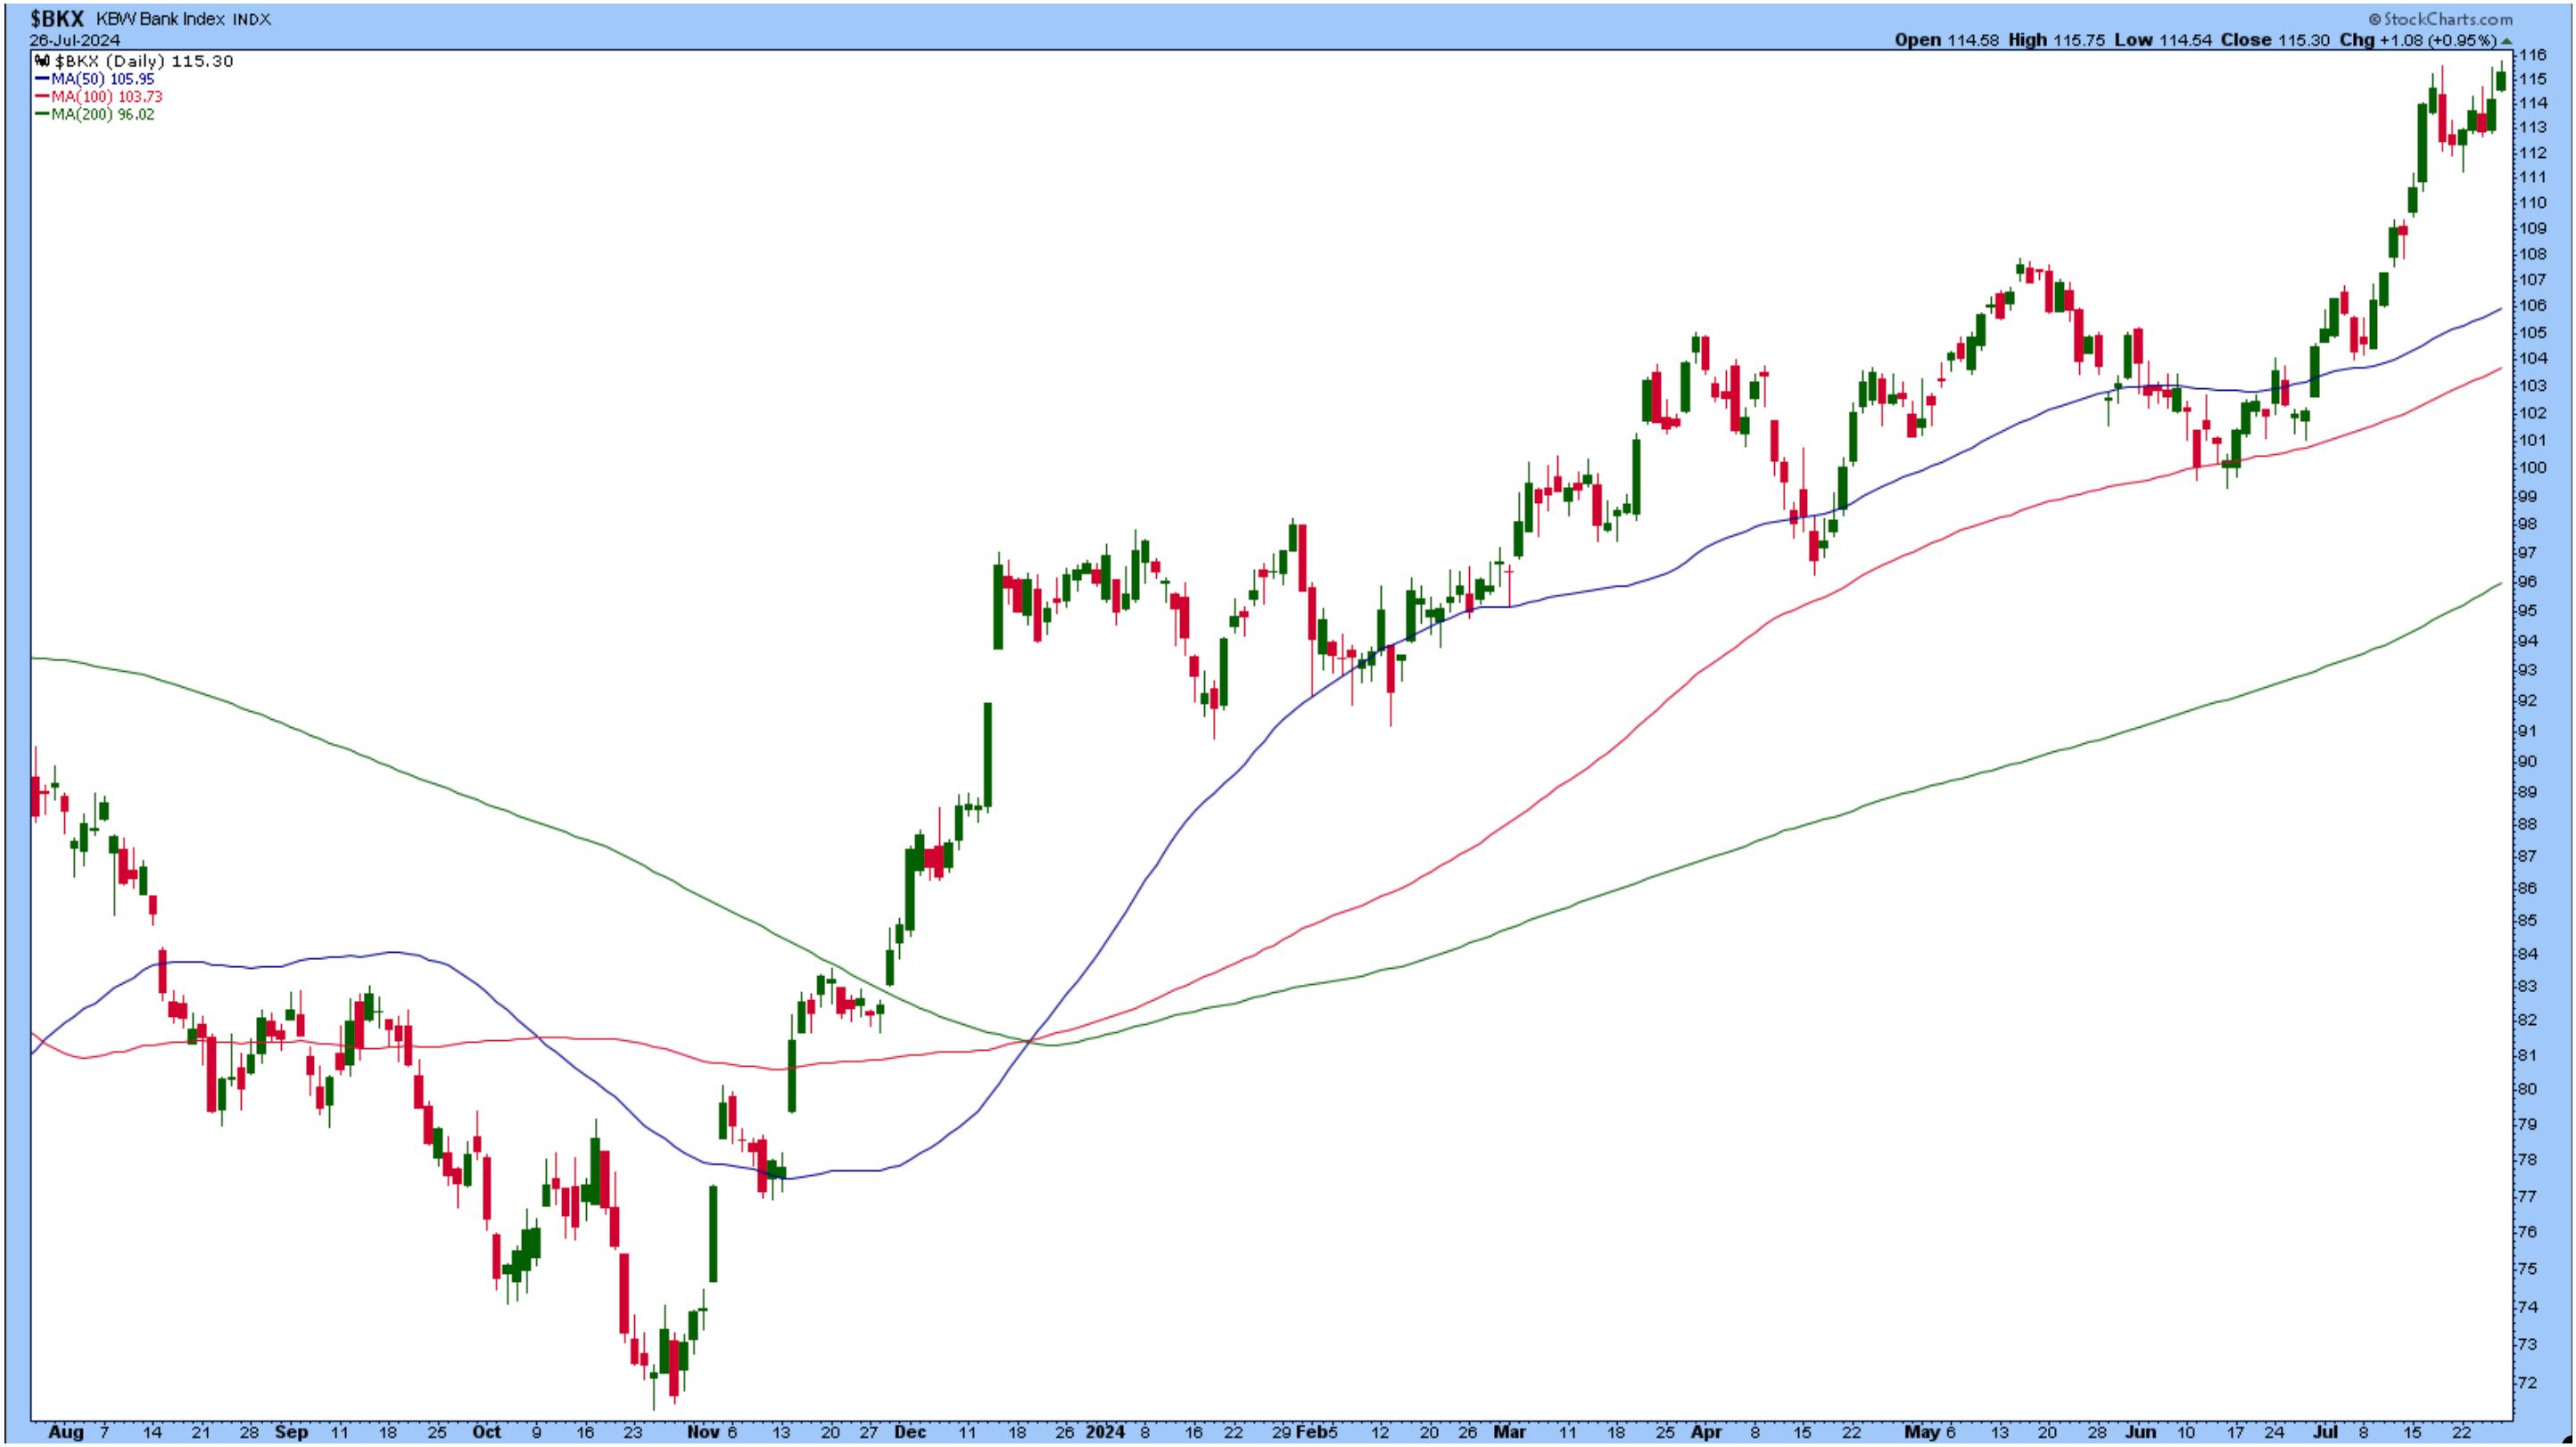
CHART 3. KBW BANK INDEX HITS NEW 52-WEEK HIGH. Expectations of cuts in interest rates this year sent bank stocks higher. Chart source: StockCharts.com. For educational purposes.
The stock market is forward-looking, so it's important to pay attention to what comes next. We're entering a week of heavy earnings from some big mega-cap tech stocks. There's also the Fed meeting. While no rate cuts are expected in next week's meeting (the CME FedWatch Tool shows a 95.3% probability of no rate cuts in July), investors will listen closely to Chairman Powell's comments during his presser. Next week is also an economic data-heavy week with July Manufacturing PMI and Non-Farm Payrolls. Both will give some indication of the US economic landscape.
Expect some market volatility next week. Although the Cboe Volatility Index ($VIX) eased on Friday, it's still high, relatively speaking. Each day in the market is different. Take each day as it comes.
End-of-Week Wrap-Up
- S&P 500 closed down 0.83% for the week, at 5459.10, Dow Jones Industrial Average up 0.75% for the week at 40,589.34; Nasdaq Composite closed down 2.08% for the week at 17357.88.
- $VIX down 0.79% for the week closing at 16.39
- Best performing sector for the week: Utilities
- Worst performing sector for the week: Consumer Discretionary
- Top 5 Large Cap SCTR stocks: MicroStrategy, Inc. (MSTR); Carvana Co. (CVNA); Insmed Inc. (INSM); Tenet Healthcare Corp. (THC); Arm Holdings (ARM).
On the Radar Next Week
- FOMC meeting
- May S&P/Case-Shiller Home Price MoM
- June JOLTs Report
- July Manufacturing PMI
- July Non-Farm Payrolls
- Earnings from Advanced Micro Devices (AMD), Apple, Inc. (AAPL), Amazon.com, Inc. (AMZN), Coinbase Global Inc. (COIN), Intel Corp. (INTC), Meta Platforms (META), Microsoft Corp. (MSFT), On Semiconductor Group (ON), Snap Inc. (SNAP), and many more.
Disclaimer: This blog is for educational purposes only and should not be construed as financial advice. The ideas and strategies should never be used without first assessing your own personal and financial situation, or without consulting a financial professional.
Happy charting!


