TAKEAWAYS
- Investor sentiment has turned more bearish with a continuation of a selloff in big tech stocks.
- More earnings, an FOMC meeting, and jobs report are adding to investor uncertainty.
- Keep an eye on bond prices as the data starts to unravel.

Last week, there was a noticeable change in investor sentiment. We have so much data coming out this week, and much will rest on how the trading week ends. The S&P 500 index ($SPX) broke the uptrend, and on Tuesday, it closed at the 50-day simple moving average (SMA).
However, after the close, Microsoft (MSFT) reported earnings. The stock price dropped over 30% in after-hours trading. Although the stock recovered some of those losses, it's possible that other stocks that are reporting earnings this week—Amazon.com, Inc. (AMZN), Apple, Inc. (AAPL), and Meta Platforms, Inc. (META)—could add downside pressure in the next few days.
Will Investors Buy the Dip or Will There Be More selling?
There's no telling how the market will react to the rest of the big tech earnings. But don't forget that in addition to these earnings there's the Fed meeting on Wednesday and the July jobs report that will drop on Friday.
If investors continue to sell equities, where will they invest their cash? For a while, the narrative was that there was rotation into small-cap stocks. But looking at the daily chart of the iShares Russell 2000 ETF (IWM) below, the upside movement seems to be taking a breather.
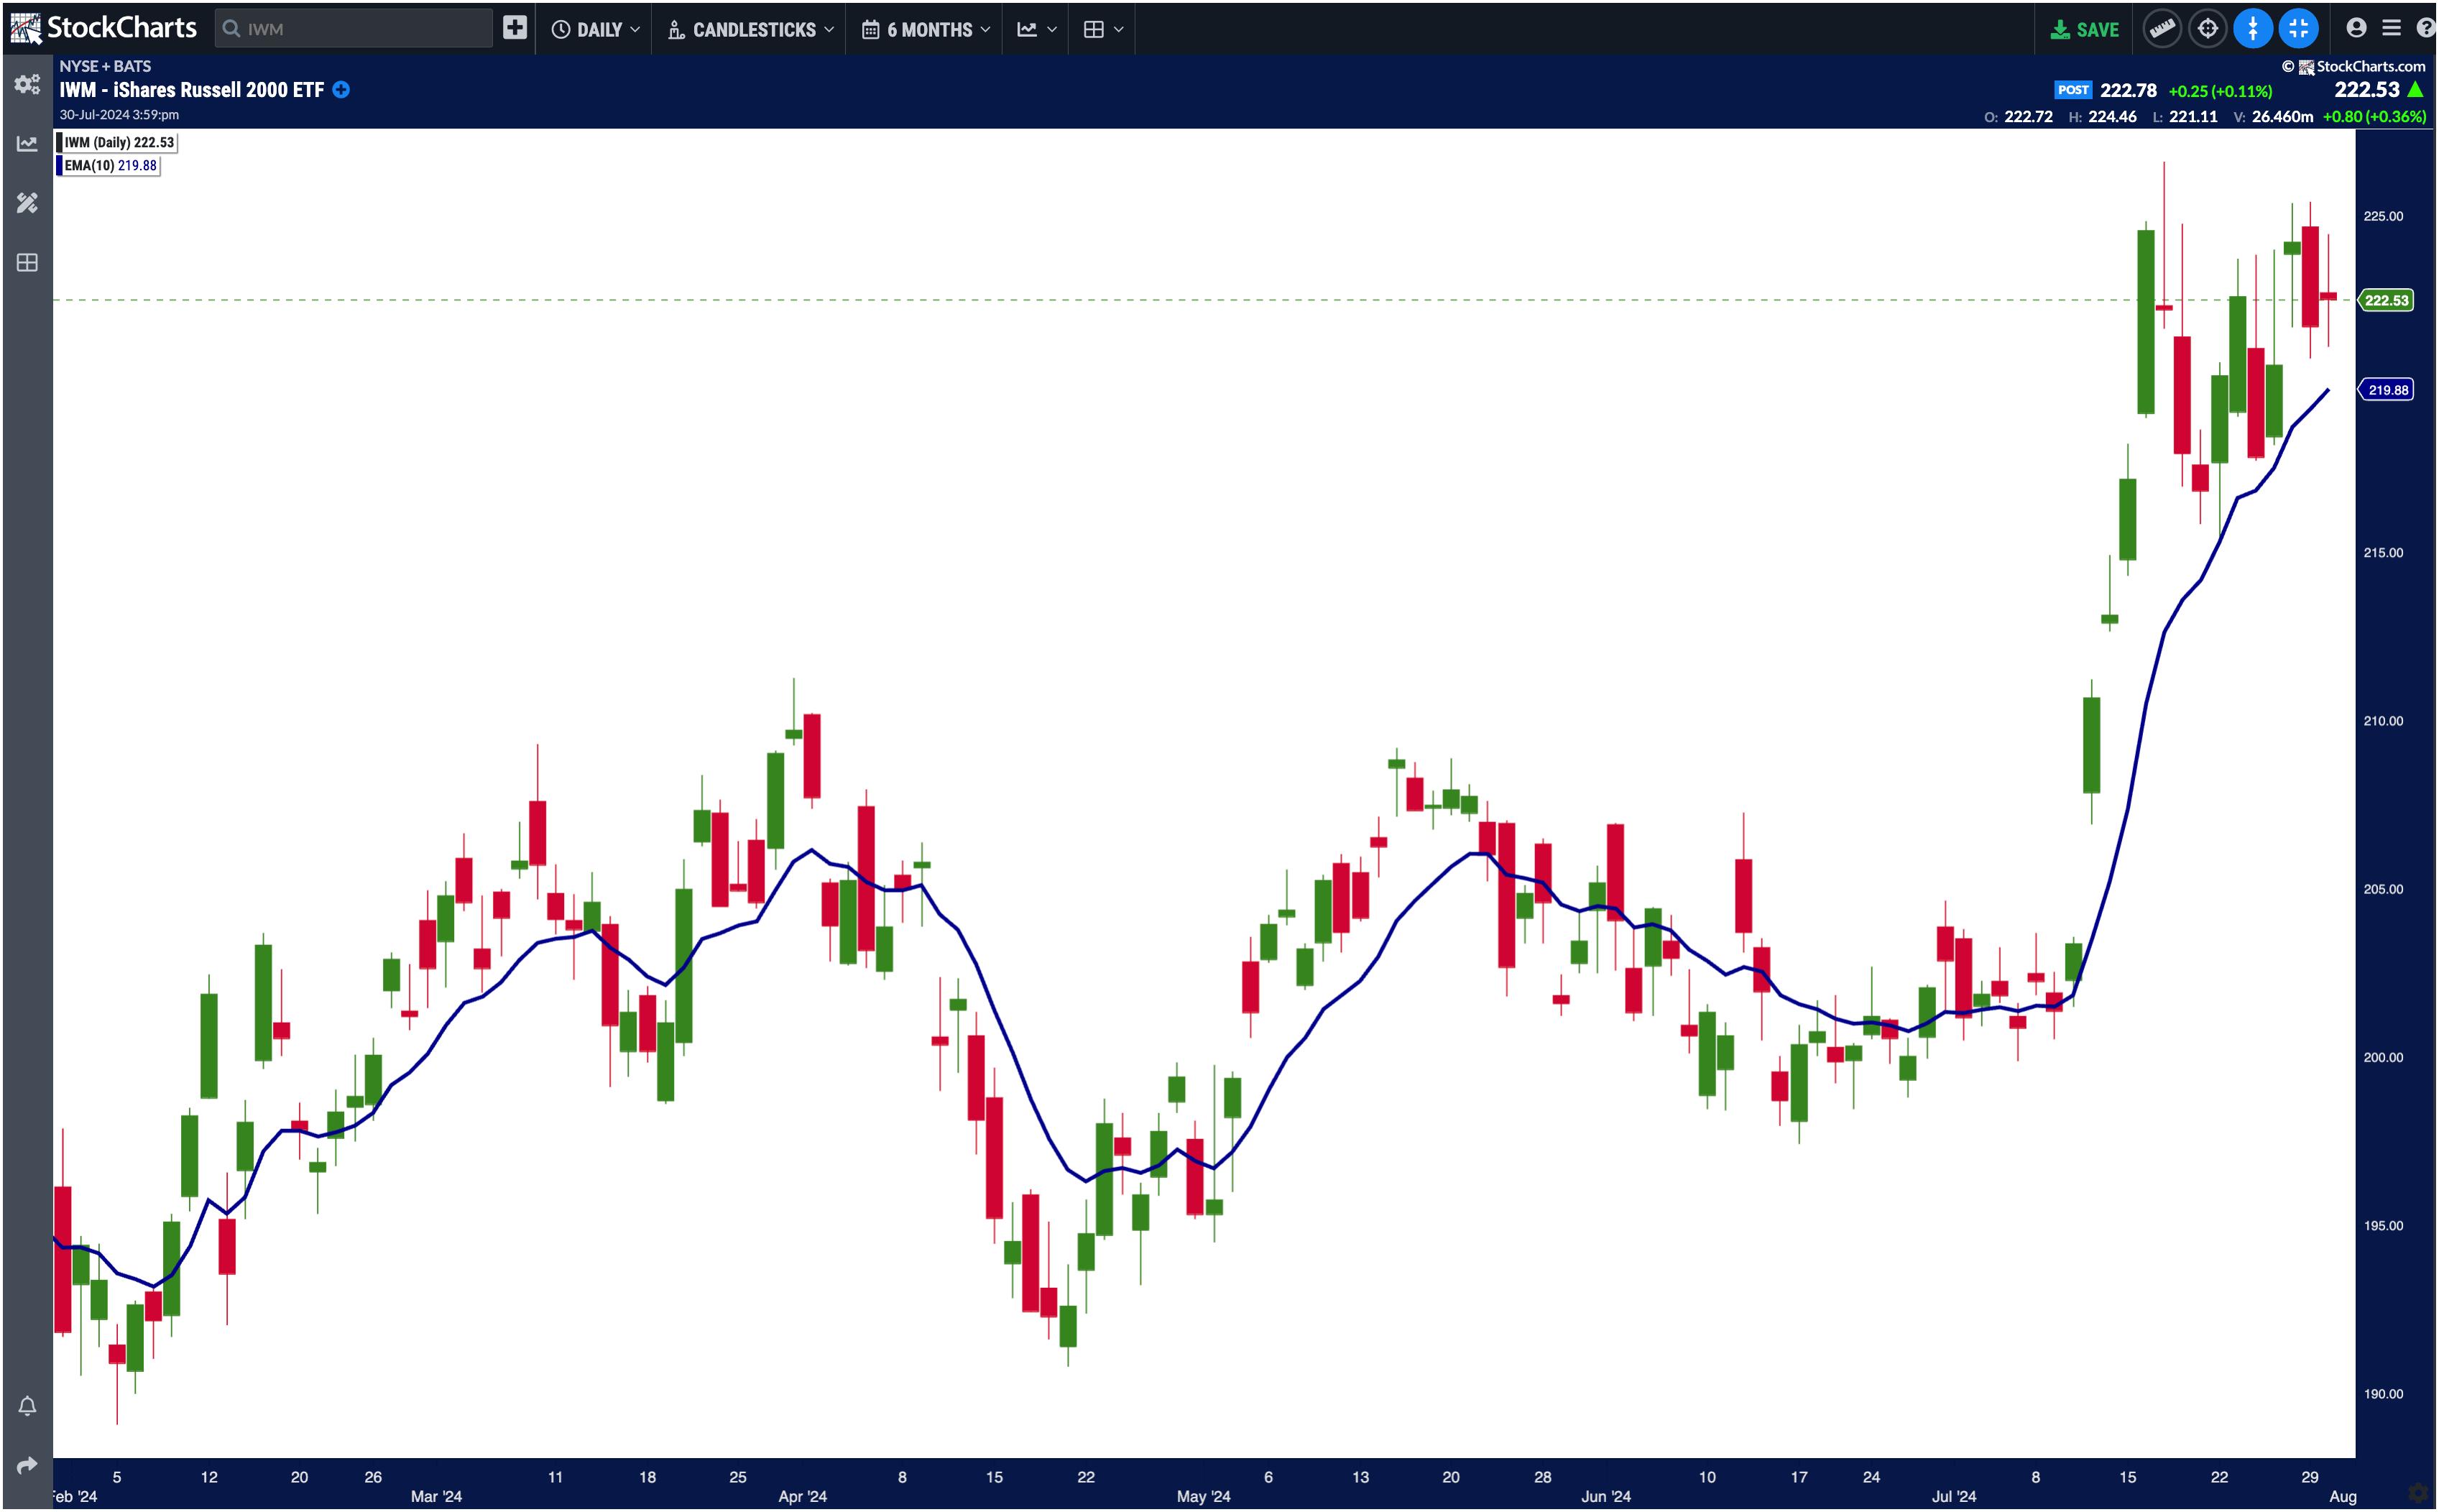
CHART 1. ARE SMALL-CAP STOCKS SHOWING SIGNS OF EXHAUSTION? While IWM is trading above its 10-day exponential moving average (EMA), the price action in the last two days indicates more selling pressure. Chart source: StockChartsACP. For educational purposes.
So, maybe the rotation is out of equities and into a "flight to safety" asset class, such as precious metals and bonds. This necessitates pulling up a chart of the SPDR Gold Shares ETF (GLD) and the iShares Silver Trust (SLV). You can see in both charts that there was a rally, but not necessarily one with huge momentum.
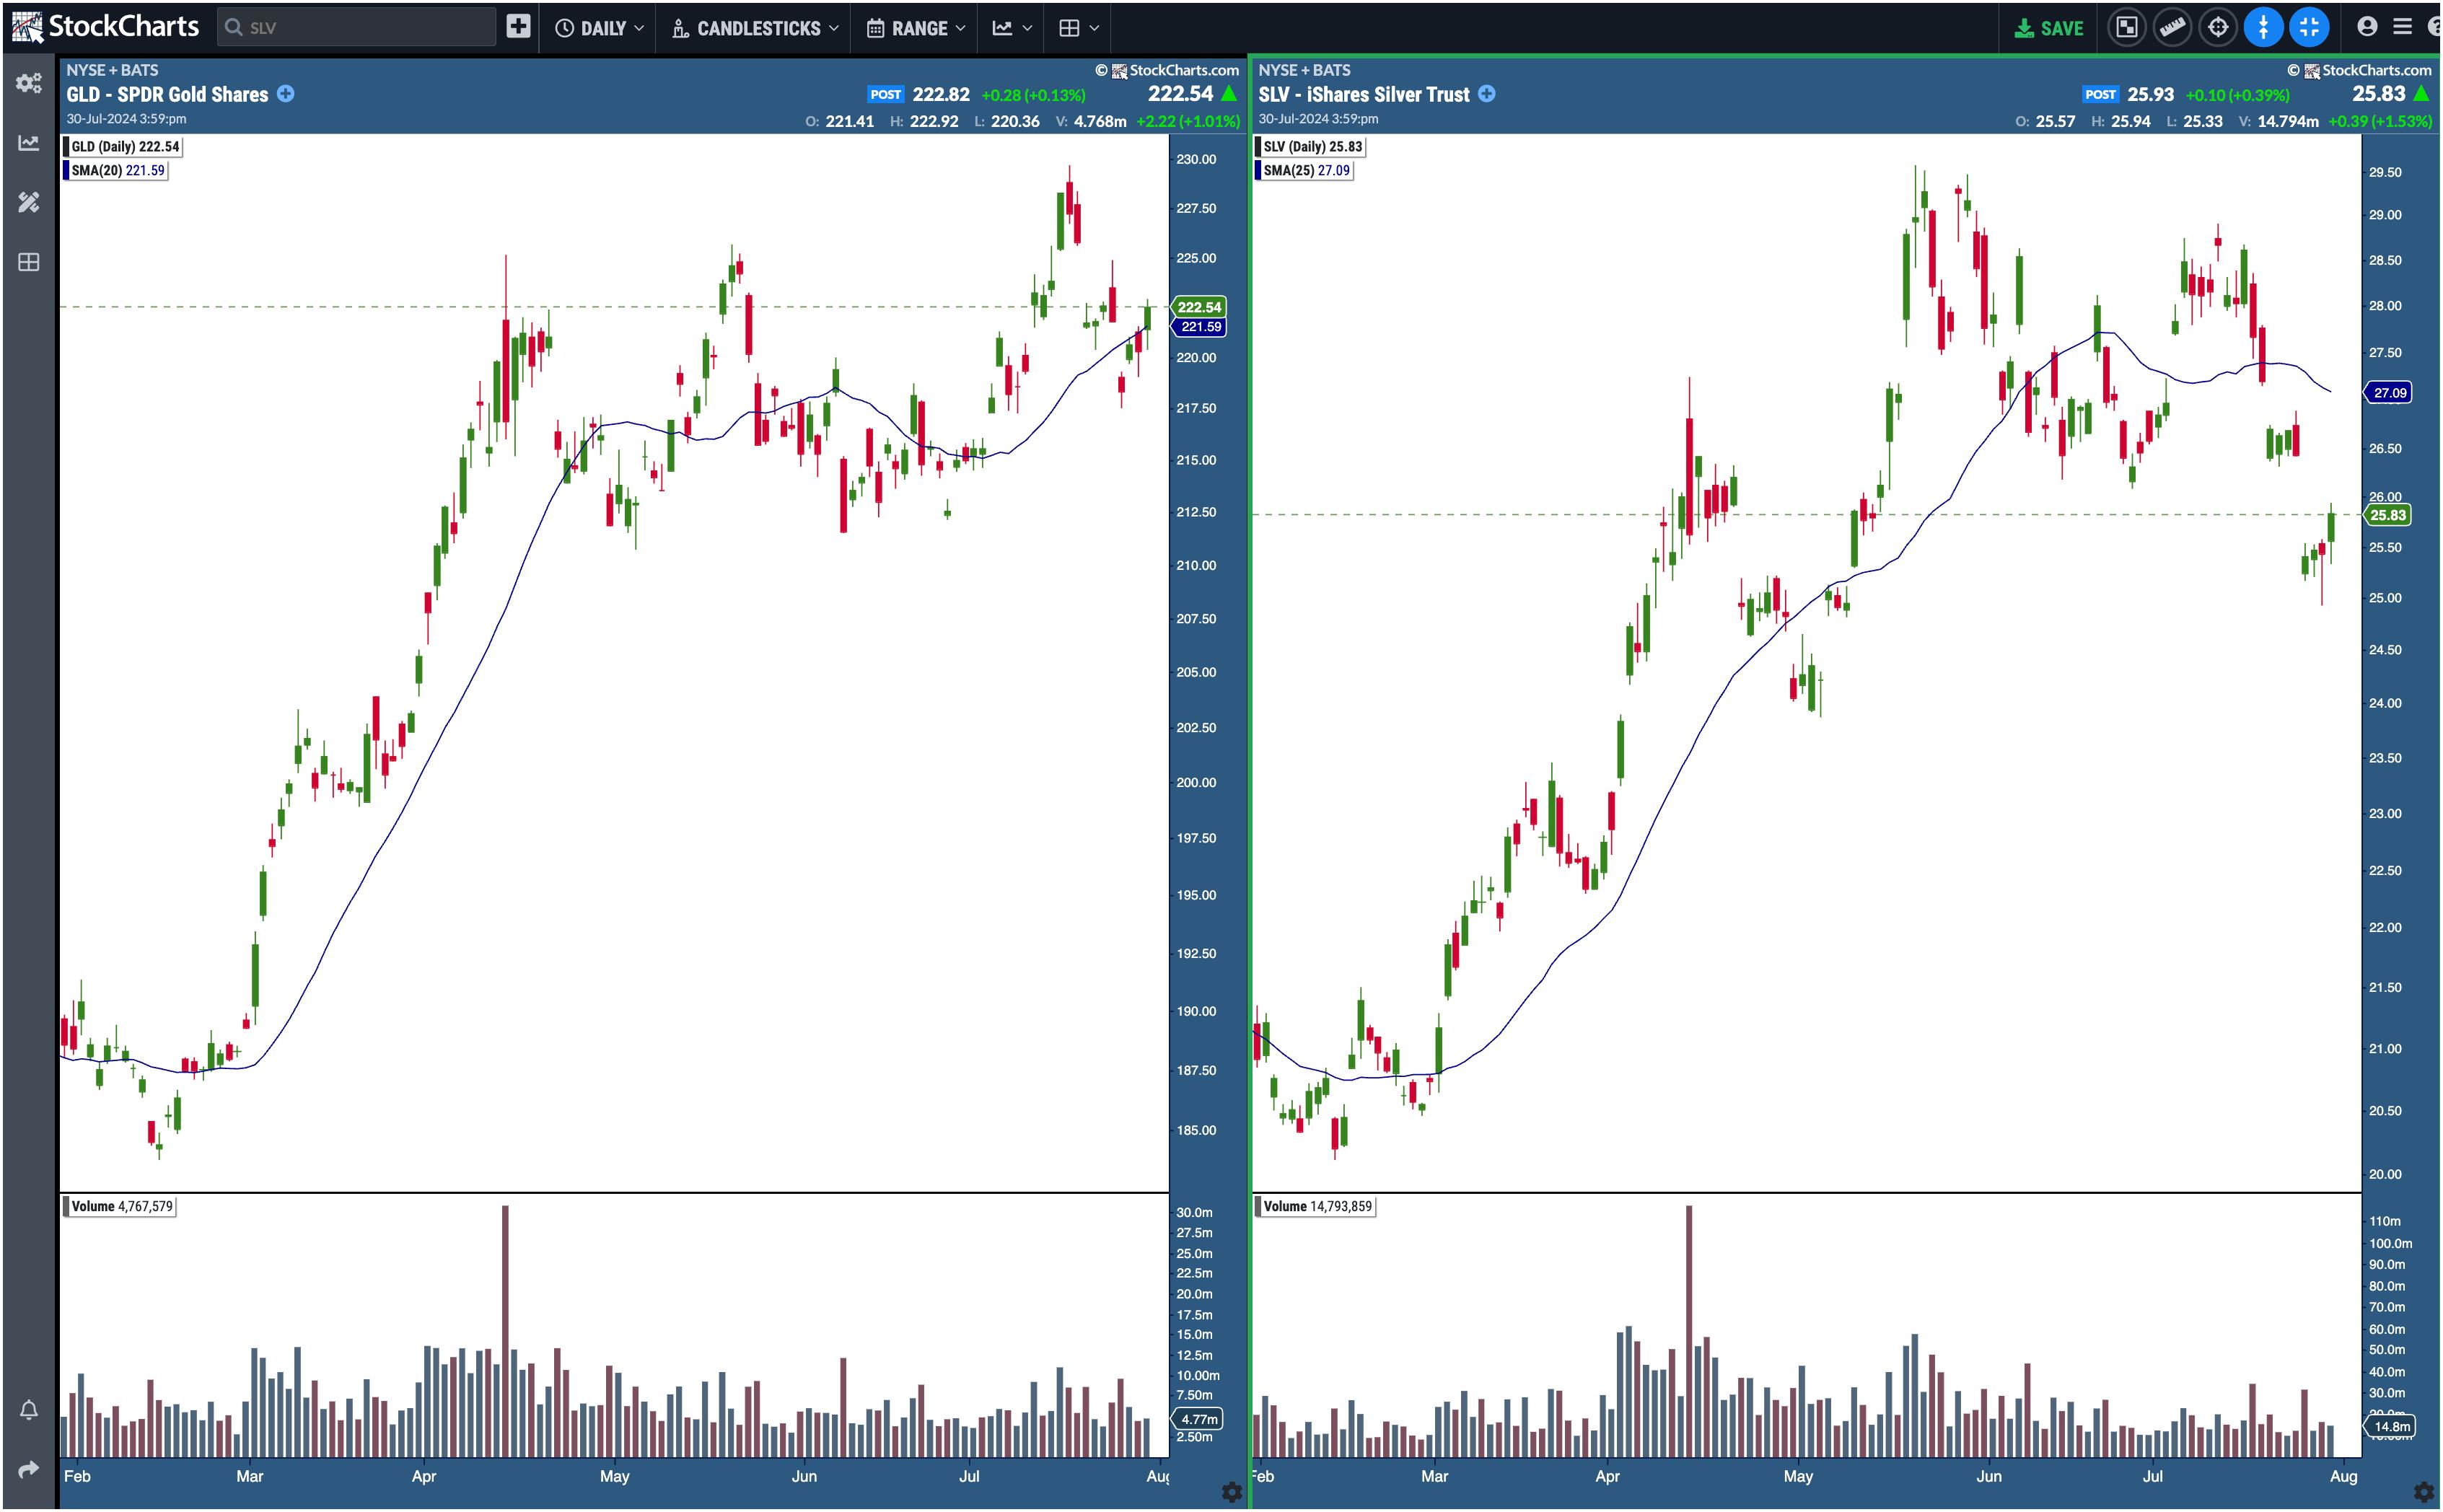
CHART 2. GOLD AND SILVER SAW SOME UPSIDE MOVEMENT. GLD traded above its 20-day SMA, but SLV still has some catching up to do before the price move can be declared an uptrend. Chart source: StockChartsACP. For educational purposes.So, if there's no gold or silver rush, are investors flocking to bonds? It's worth looking at the weekly chart of iShares 20+ Year Treasury Bond ETF (TLT). After a steady downtrend, bond prices are trying to break out of a downtrend. The downtrend line (blue dashed line) is broken, TLT is trading above its 10-week exponential moving average (EMA), and it looks like a consolidation pattern is forming. A clear breakout above this consolidation could be a reason to give bonds some love. Bonds could make a big move soon.
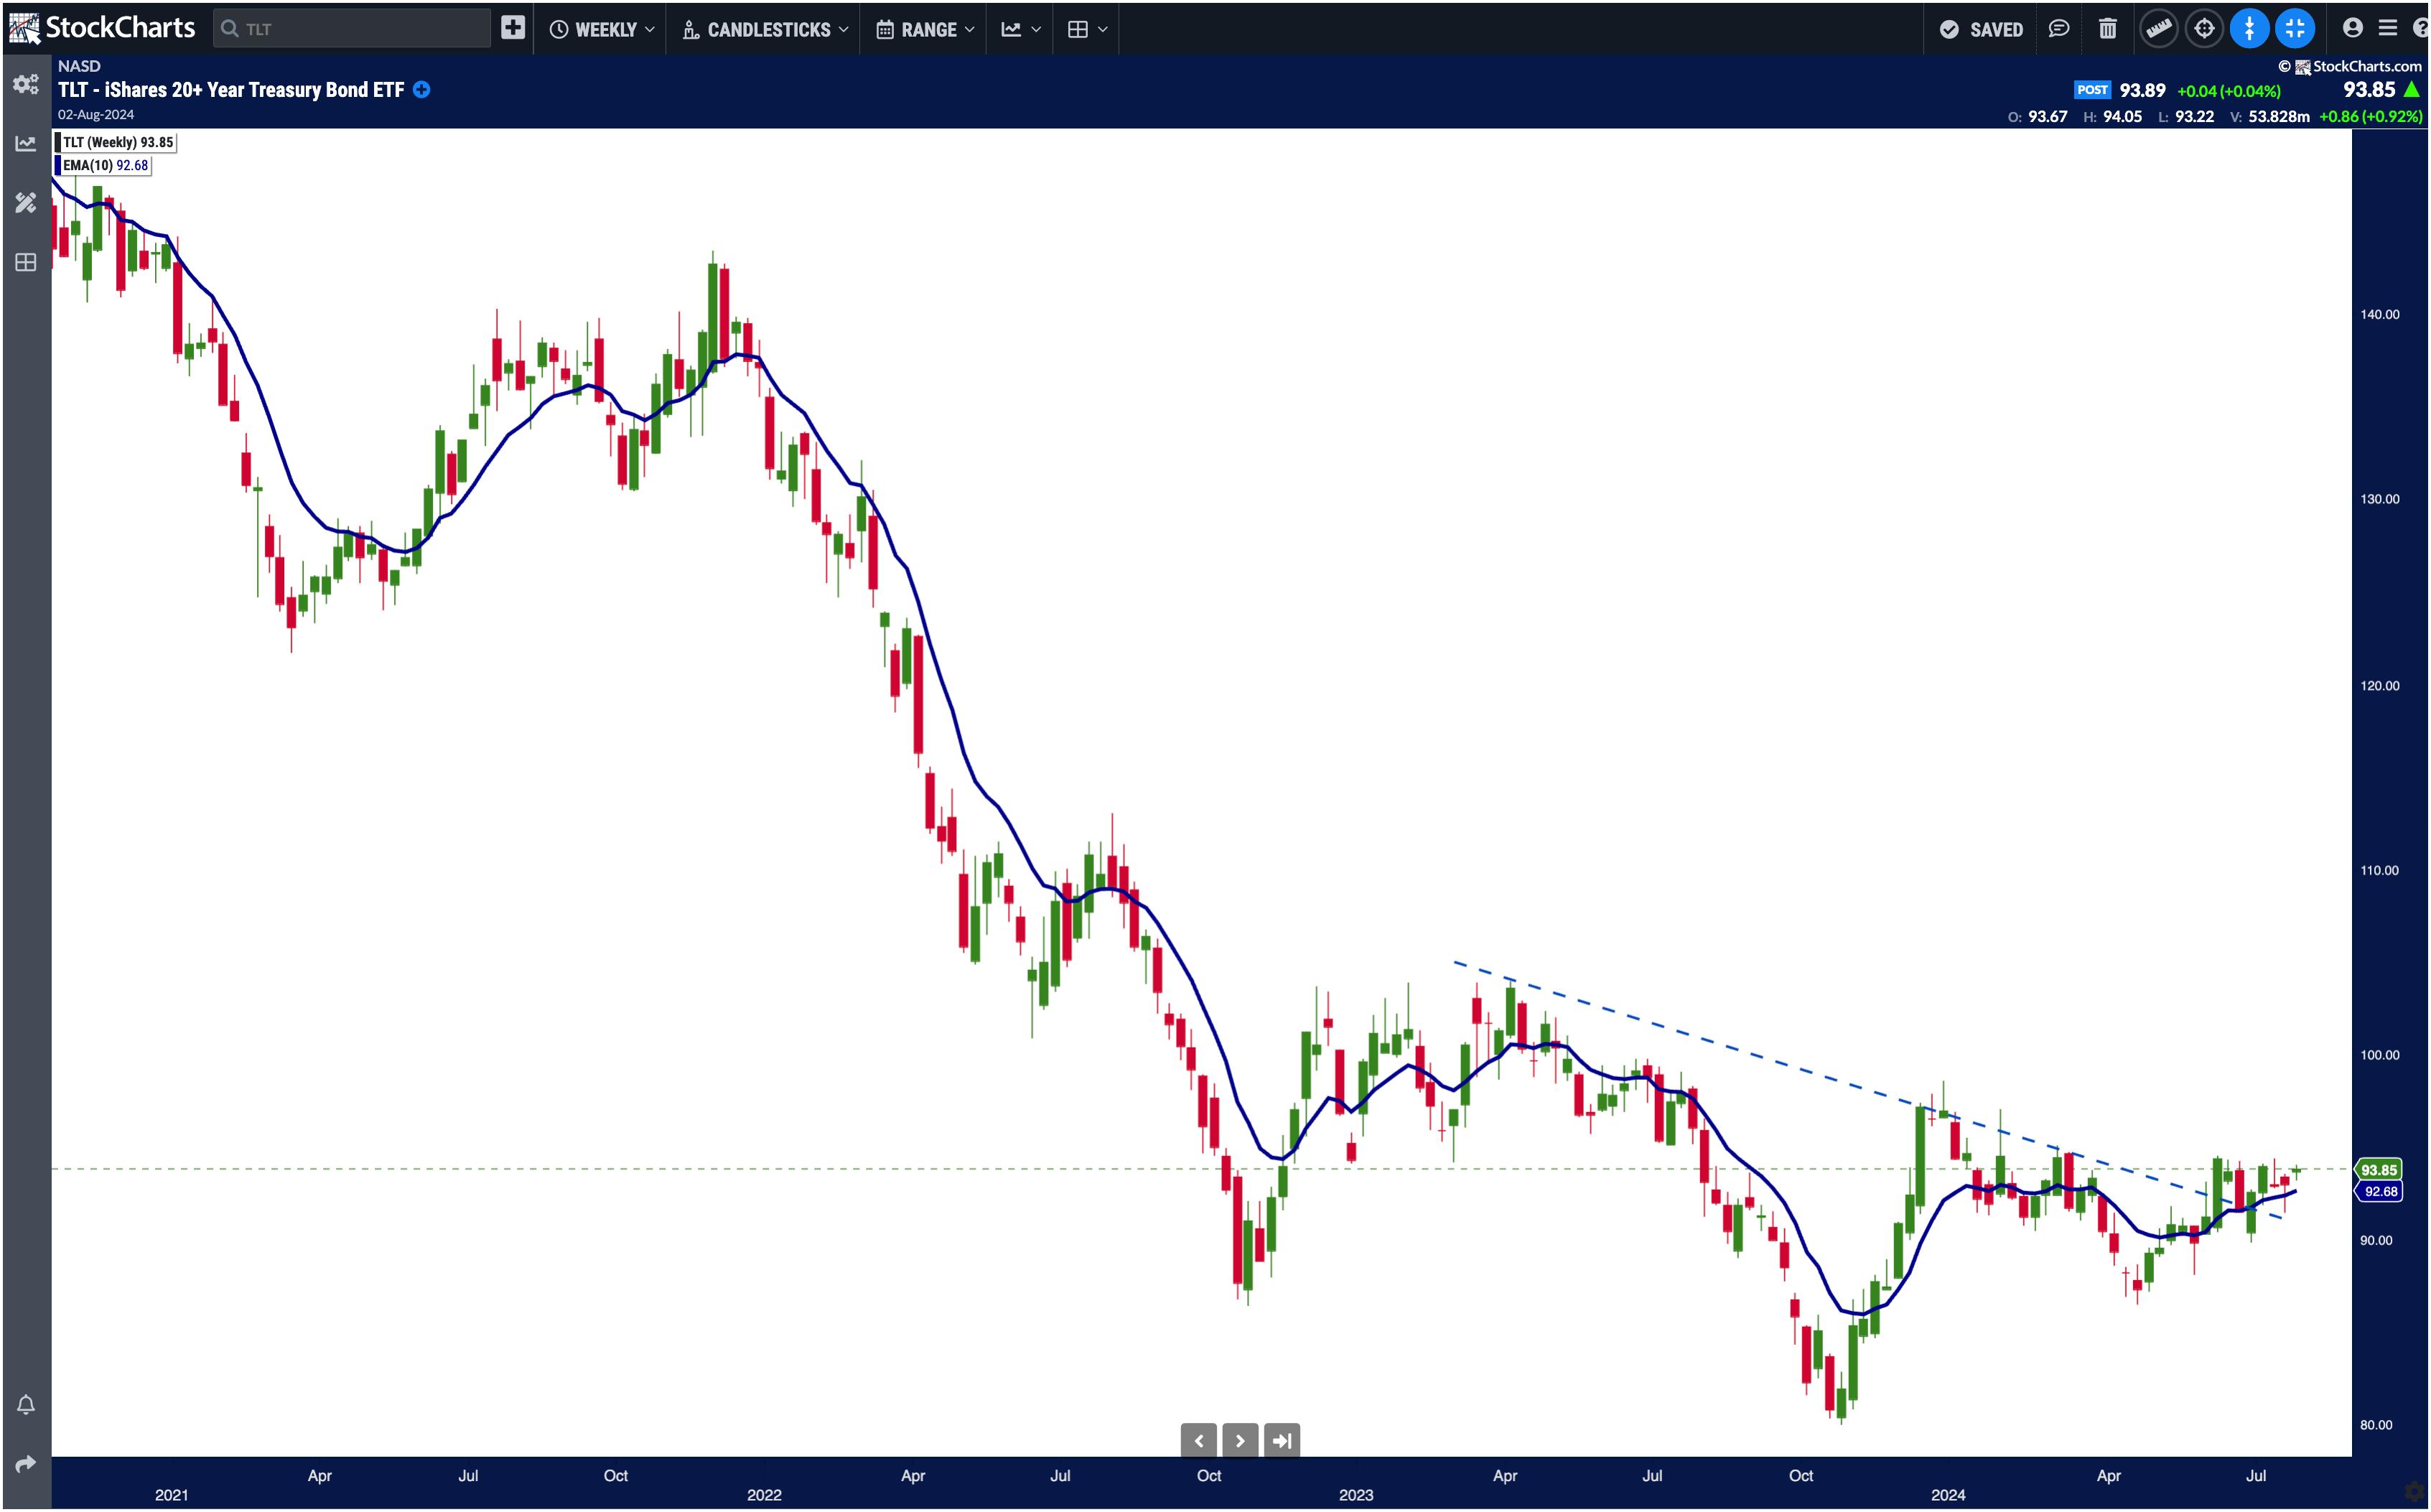
CHART 3. ARE BONDS GETTING READY TO BREAK OUT? It's hard to say, especially ahead of a FOMC meeting. Chart source: StockChartsACP. For educational purposes.
Looking at the above charts, it appears that traders are waiting for the rest of the week's data to be released. Remember, this is a weak seasonality period, so it could be some time before we can see a clear directional move in any asset class.
Volatility is also up. The Cboe Volatility Index ($VIX) is above 17, which is relatively high after a long period between 12 and 15.
Closing Position
Tomorrow, the world will hear from Fed Chairman Jerome Powell. The stock market has priced in an interest rate cut in September. Will he hint at more rate cuts this year, or will he continue to focus on the state of the US economy as he usually does? Stay tuned!

Disclaimer: This blog is for educational purposes only and should not be construed as financial advice. The ideas and strategies should never be used without first assessing your own personal and financial situation, or without consulting a financial professional.
Happy charting!


