TAKEAWAYS
- Weak manufacturing and jobs data sends investors into panic mode
- All broader stock market indexes fall over 2%
- Bond prices rise
The dog days of summer are here. And the stock market gives us a brutal reminder of this.
The first trading day of August began on a very pessimistic note. Thursday's weak manufacturing data spooked the stock market. All broad stock market indexes, including the S&P 600 Small-Cap Index ($SML) and the S&P 400 Mid-Cap Index ($MID), fell sharply after the Purchasing Managers' Index (PMI) from the Institute of Supply Management (ISM) came in at 46.8 (below 50 indicates contraction).
Friday was even worse after the July jobs report data was well below expectations. The broader indexes continued their slide with the charts of the broader equity indexes ending the week with technical breakdowns. But in the recent past, hasn't the stock market rejoiced when a softer jobs number was released?
It's Different This Time
Thursday's quick shift from green to red shows how this market can shift on a dime. On Wednesday, investors were optimistic about a rate cut in September after hearing Fed Chairman Powell's comments after the FOMC meeting. Maybe those comments were fresh in everyone's minds because the following day, investor sentiment shifted drastically.
After the PMI data came out, concern grew that perhaps the Fed's decision to leave interest rates unchanged in the July meeting may not have been a smart decision. A September rate cut may be too late.
Friday's weaker-than-expected employment report didn't help. It magnified the fear and accelerated the selloff in equities. If you dig deeper into the report, it's enough to create some fear. If the labor force participation rate is rising, as is evident in the July NFP, but there aren't enough jobs to hire the additional job seekers, unemployment will rise.
The fear has now shifted from a soft landing to a possible recession. That the Fed hasn't cut interest rates yet is maybe enough reason for investors to wrap up for the rest of the summer months and reset in September.
Two bad reports like the ones we just got tend to set off red flags. Stocks got slammed across the board—large caps, mid-caps, small caps, tech stocks, and industrials—all underwent significant drops. Another shift can be seen in the CME FedWatch Tool. Since the July NFP report, there's a 73.5% chance of a 50 basis-points rate cut in September.
Sentiment Shift
So, how bad was the technical damage? The weekly chart of the S&P 500 ($SPX) shows it tested its 20-week simple moving average (SMA) support and closed slightly above it. So, from a longer-term perspective, the damage isn't as deteriorating as your portfolio or daily chart may suggest.
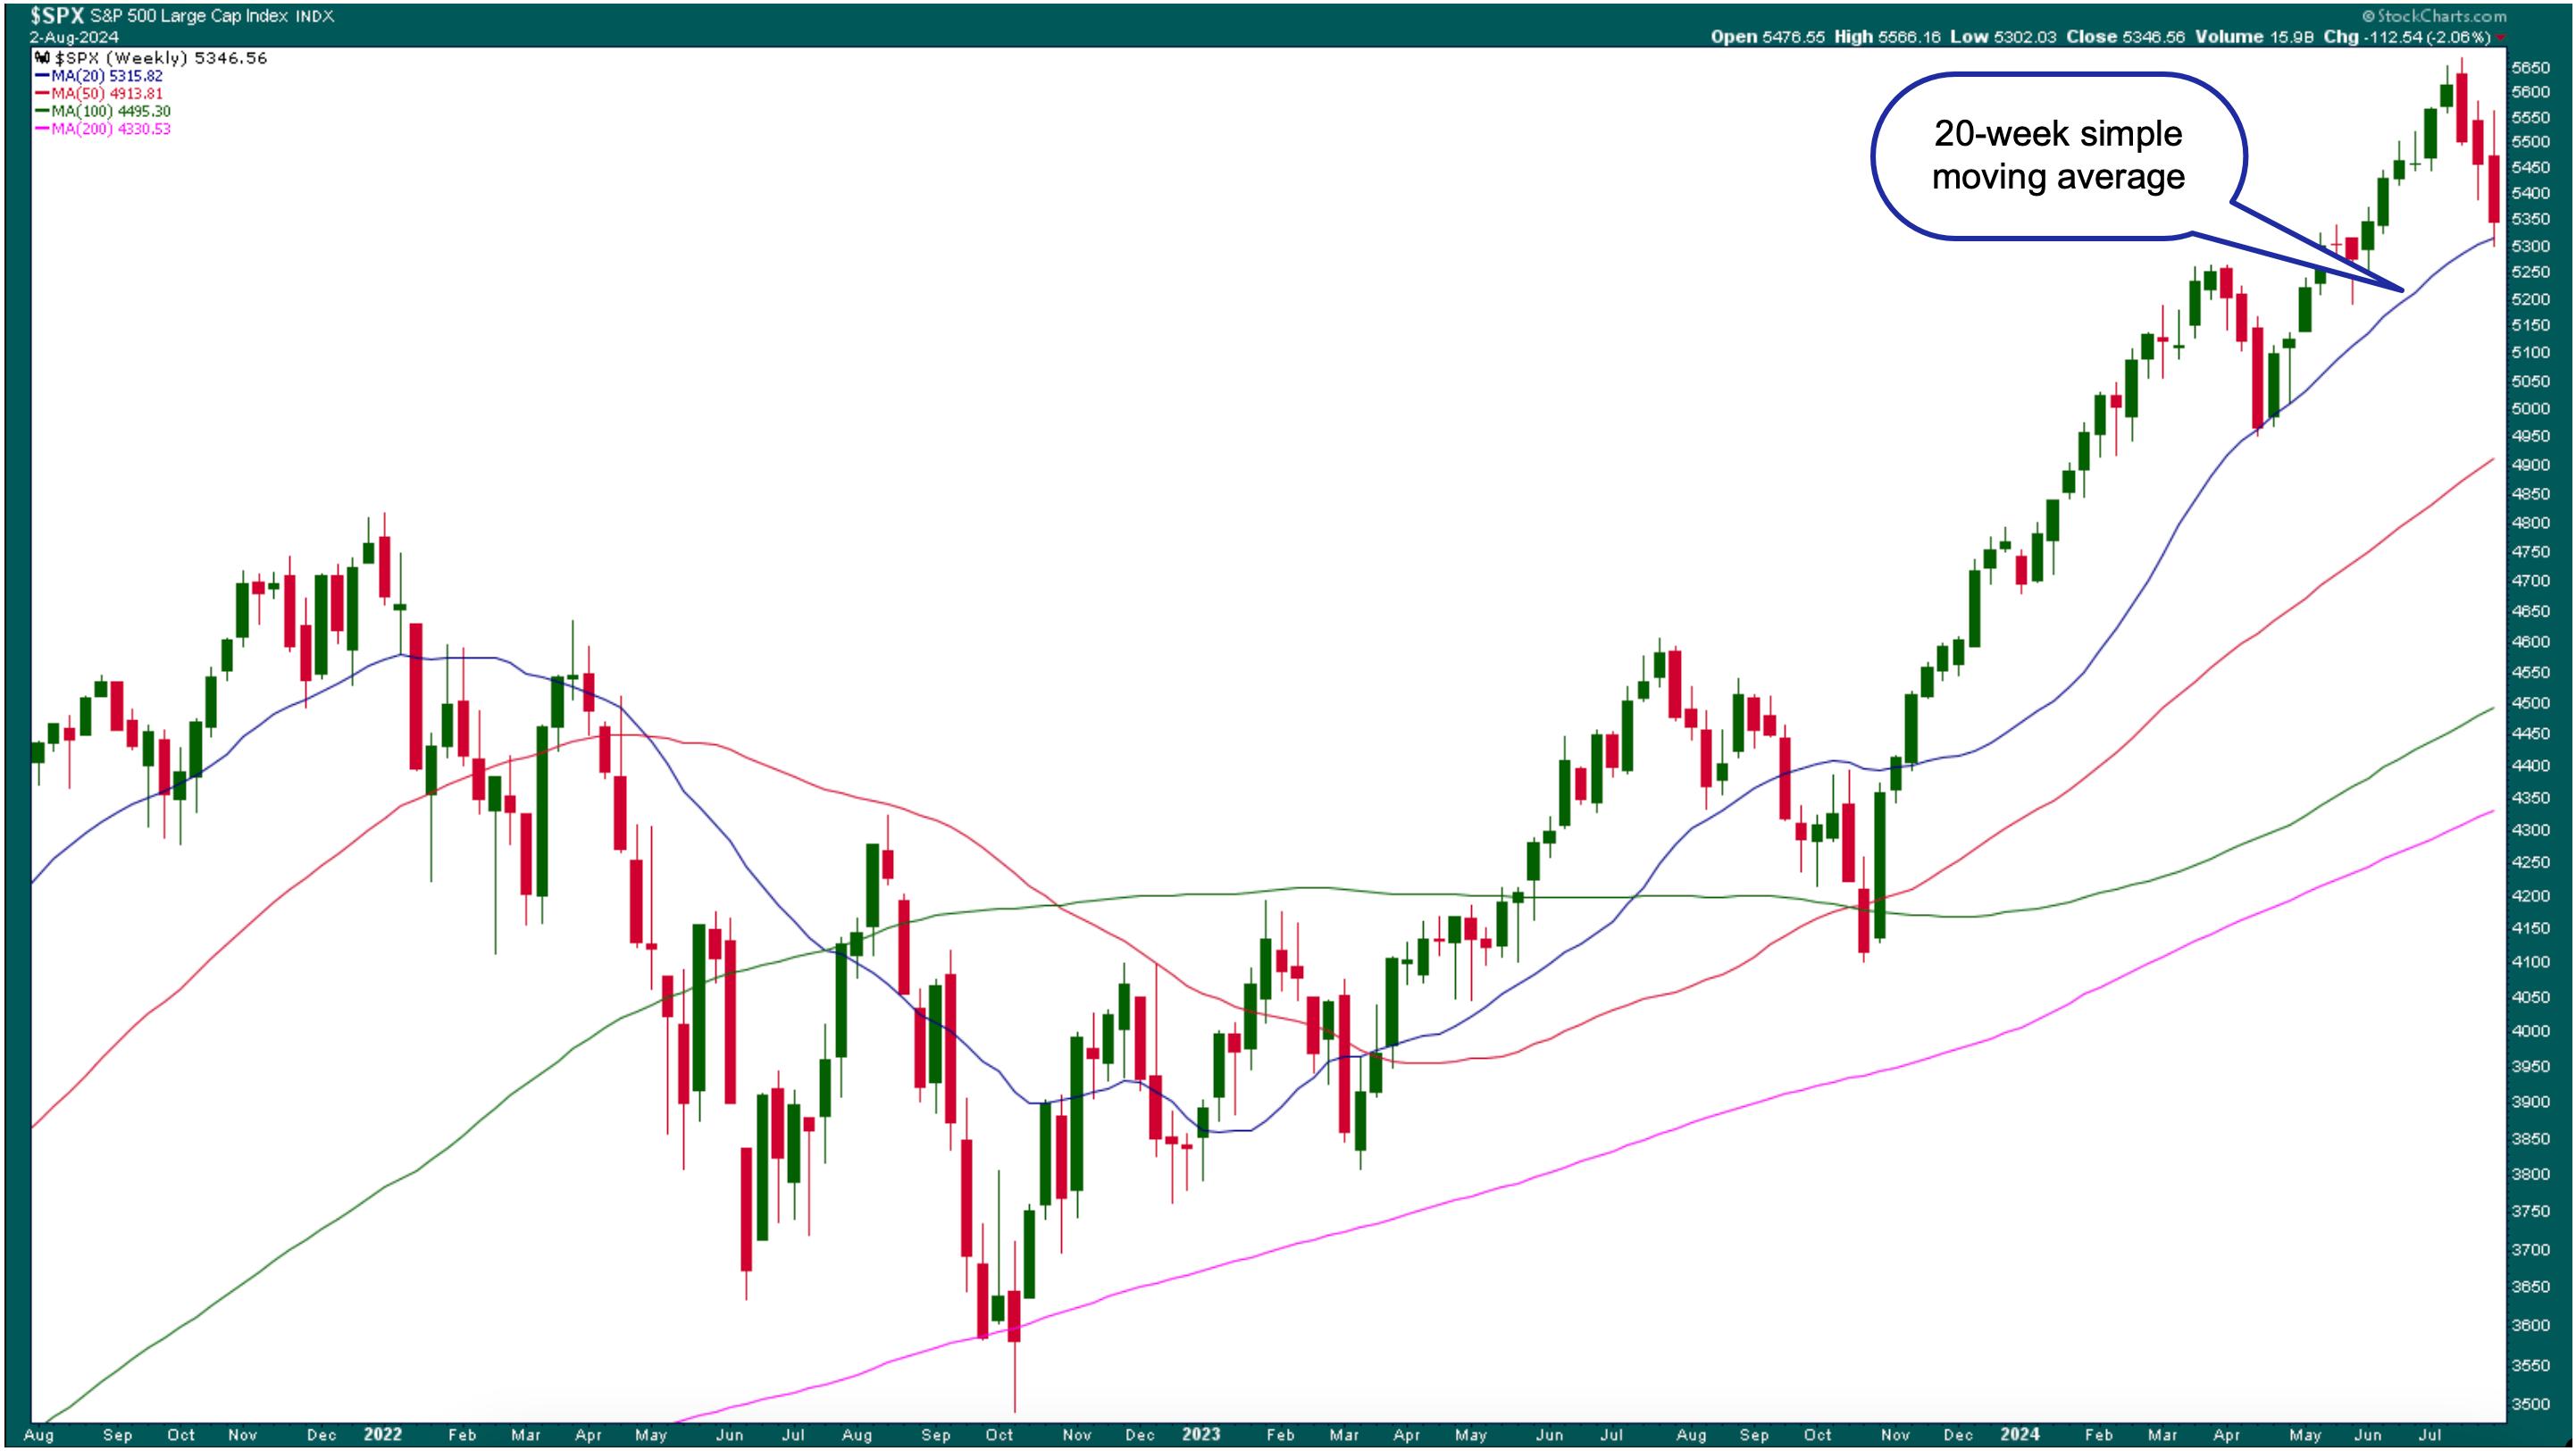
CHART 1. WEEKLY CHART OF S&P 500 INDEX. The index tested its 20-week moving average. Will it hold? That's something to watch next week. Chart source: StockCharts.com. For educational purposes.
The daily chart tells another story. If there were one word to describe the action in the daily chart below, it would be "wipeout." Well, maybe it's not that bad.
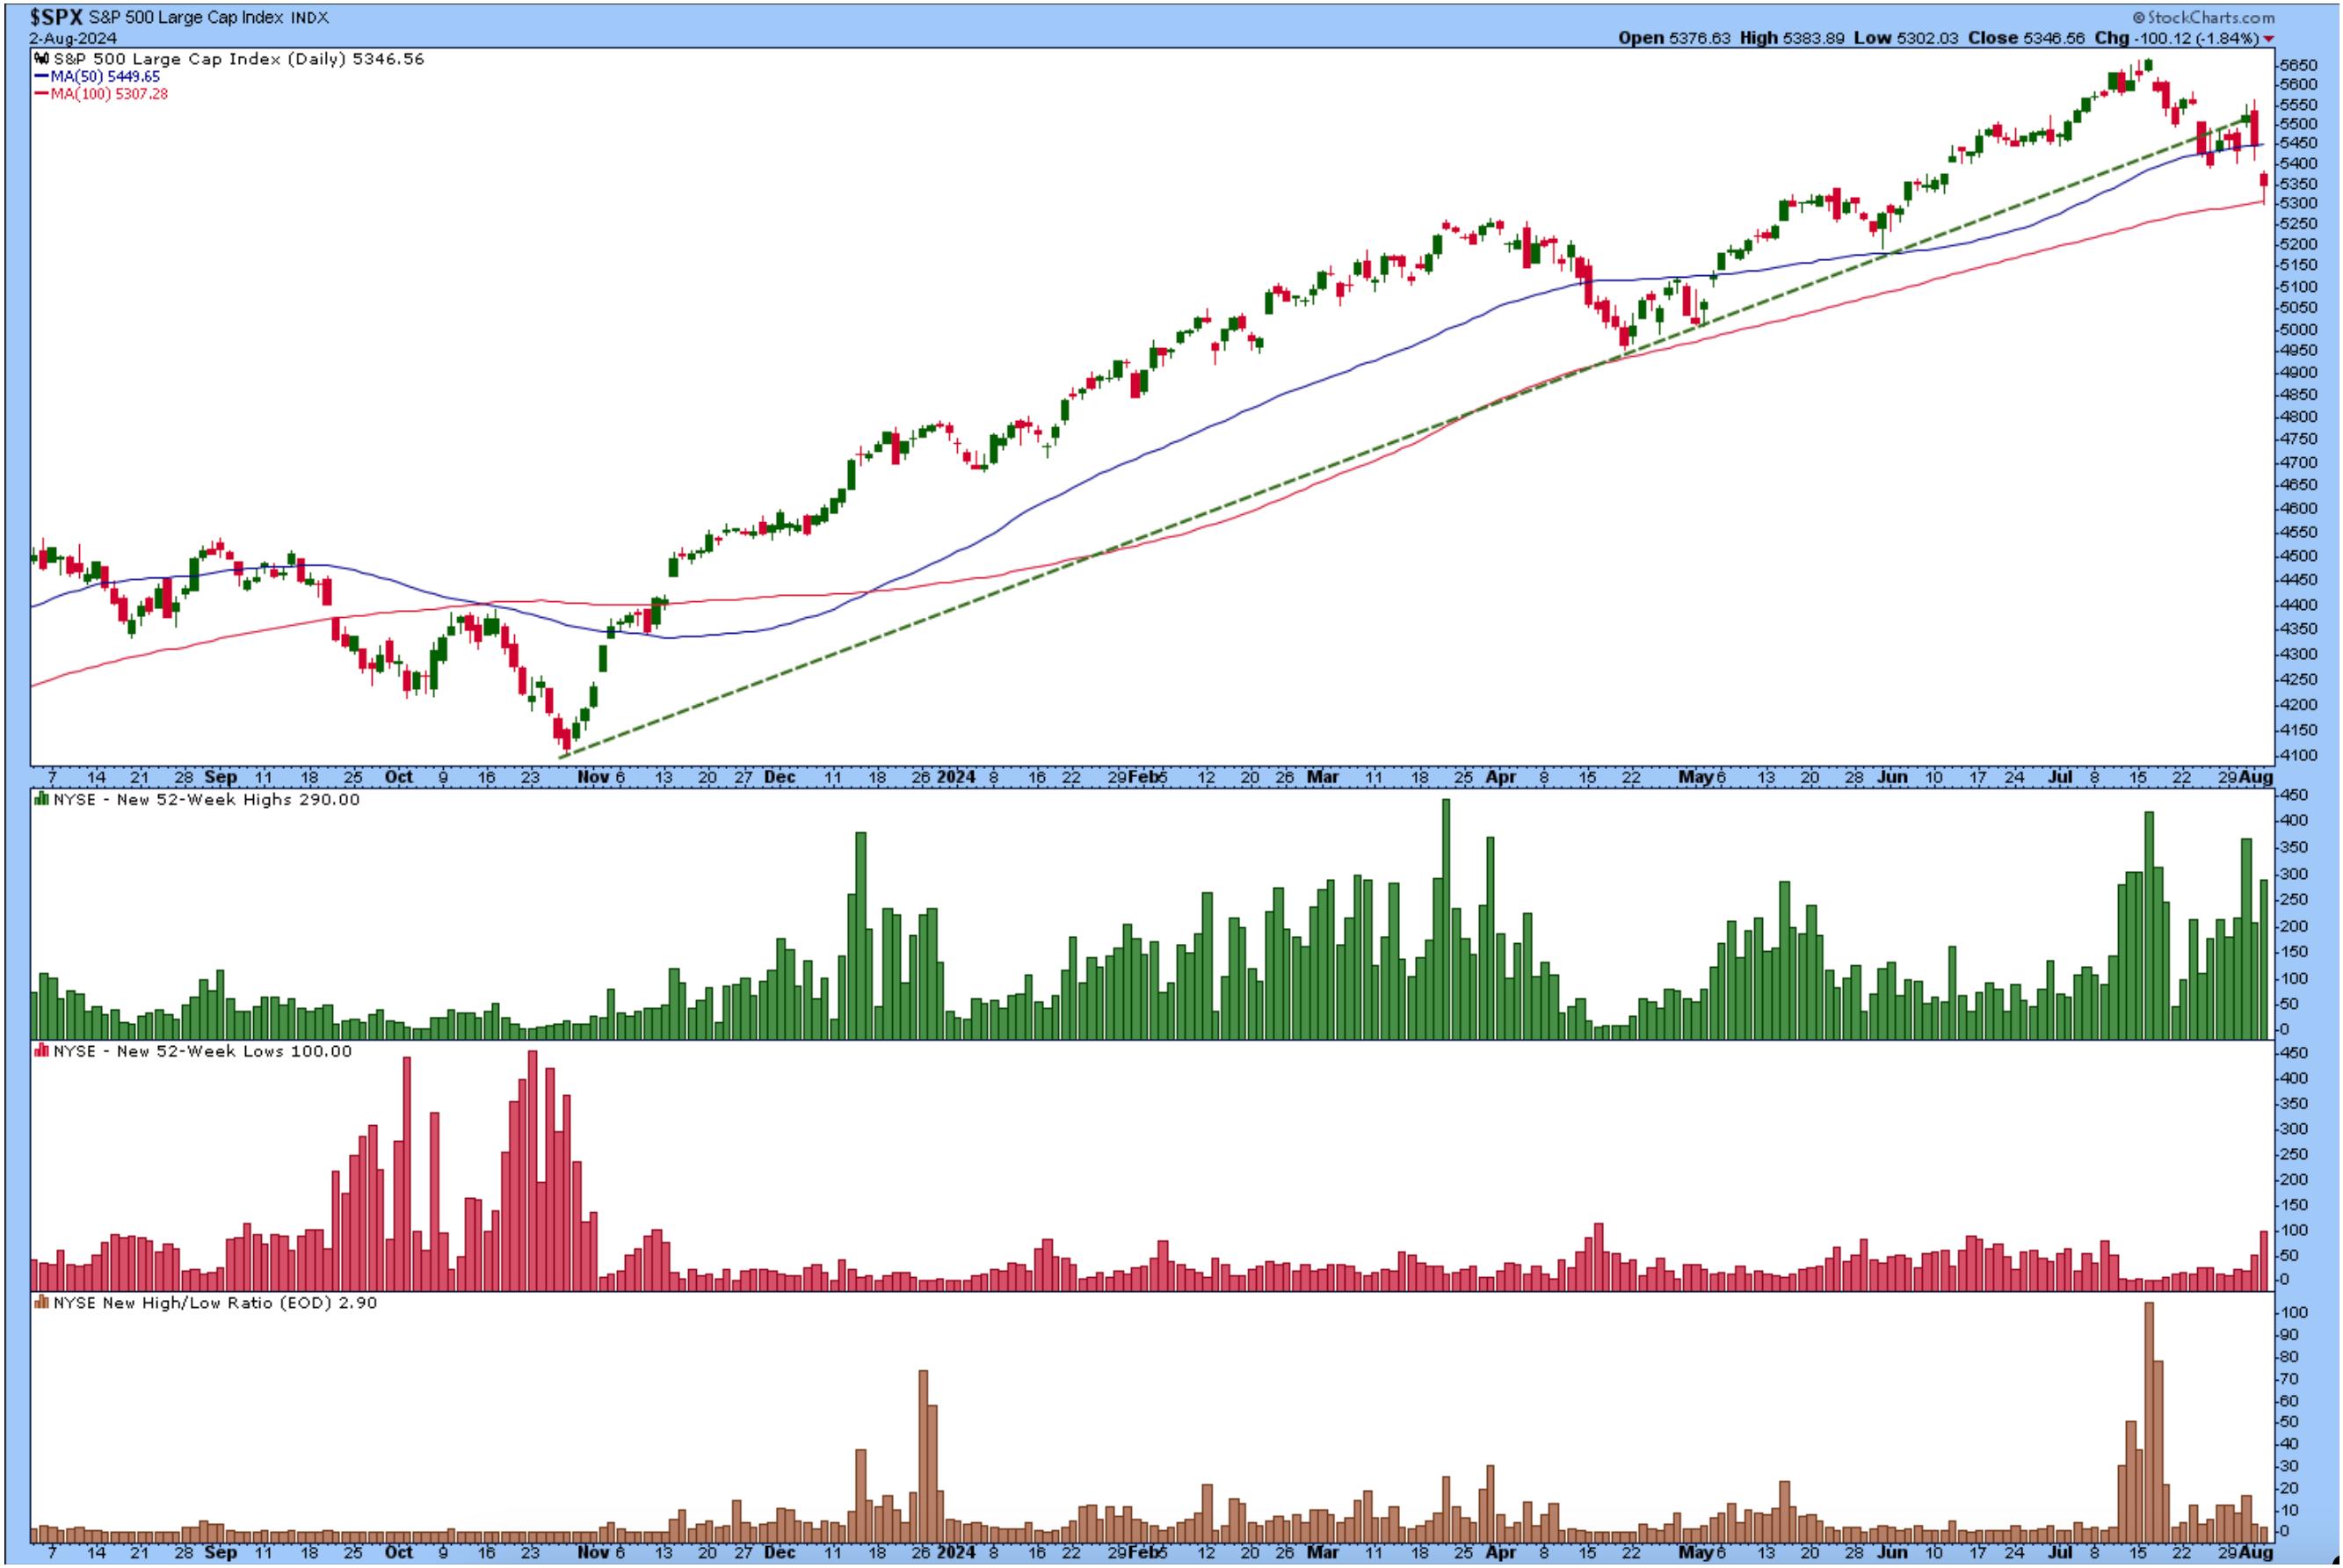
CHART 2. DAILY CHART OF THE S&P 500 INDEX. The index has broken below the trendline from the October lows but is now at its 100-day simple moving average support. Chart source: StockCharts.com. For educational purposes.
The S&P 500 has broken below its upward trendline from the October lows and is now testing its 100-day SMA support. The market breadth indicators in the lower panels aren't showing too much weakening, but it's something to watch for.
If the S&P 500 continues its downward move into next week, it could challenge the April lows before returning to firm ground. That would be about a 13% decline in value, which could be a healthy correction. That can be painful to deal with in an overextended market.
The Nasdaq Composite ($COMPQ) was hit even harder than the S&P 500. In the Nasdaq's weekly chart, you can see the index is at the support of its 25-week SMA and also hit the support of its March 18 high.
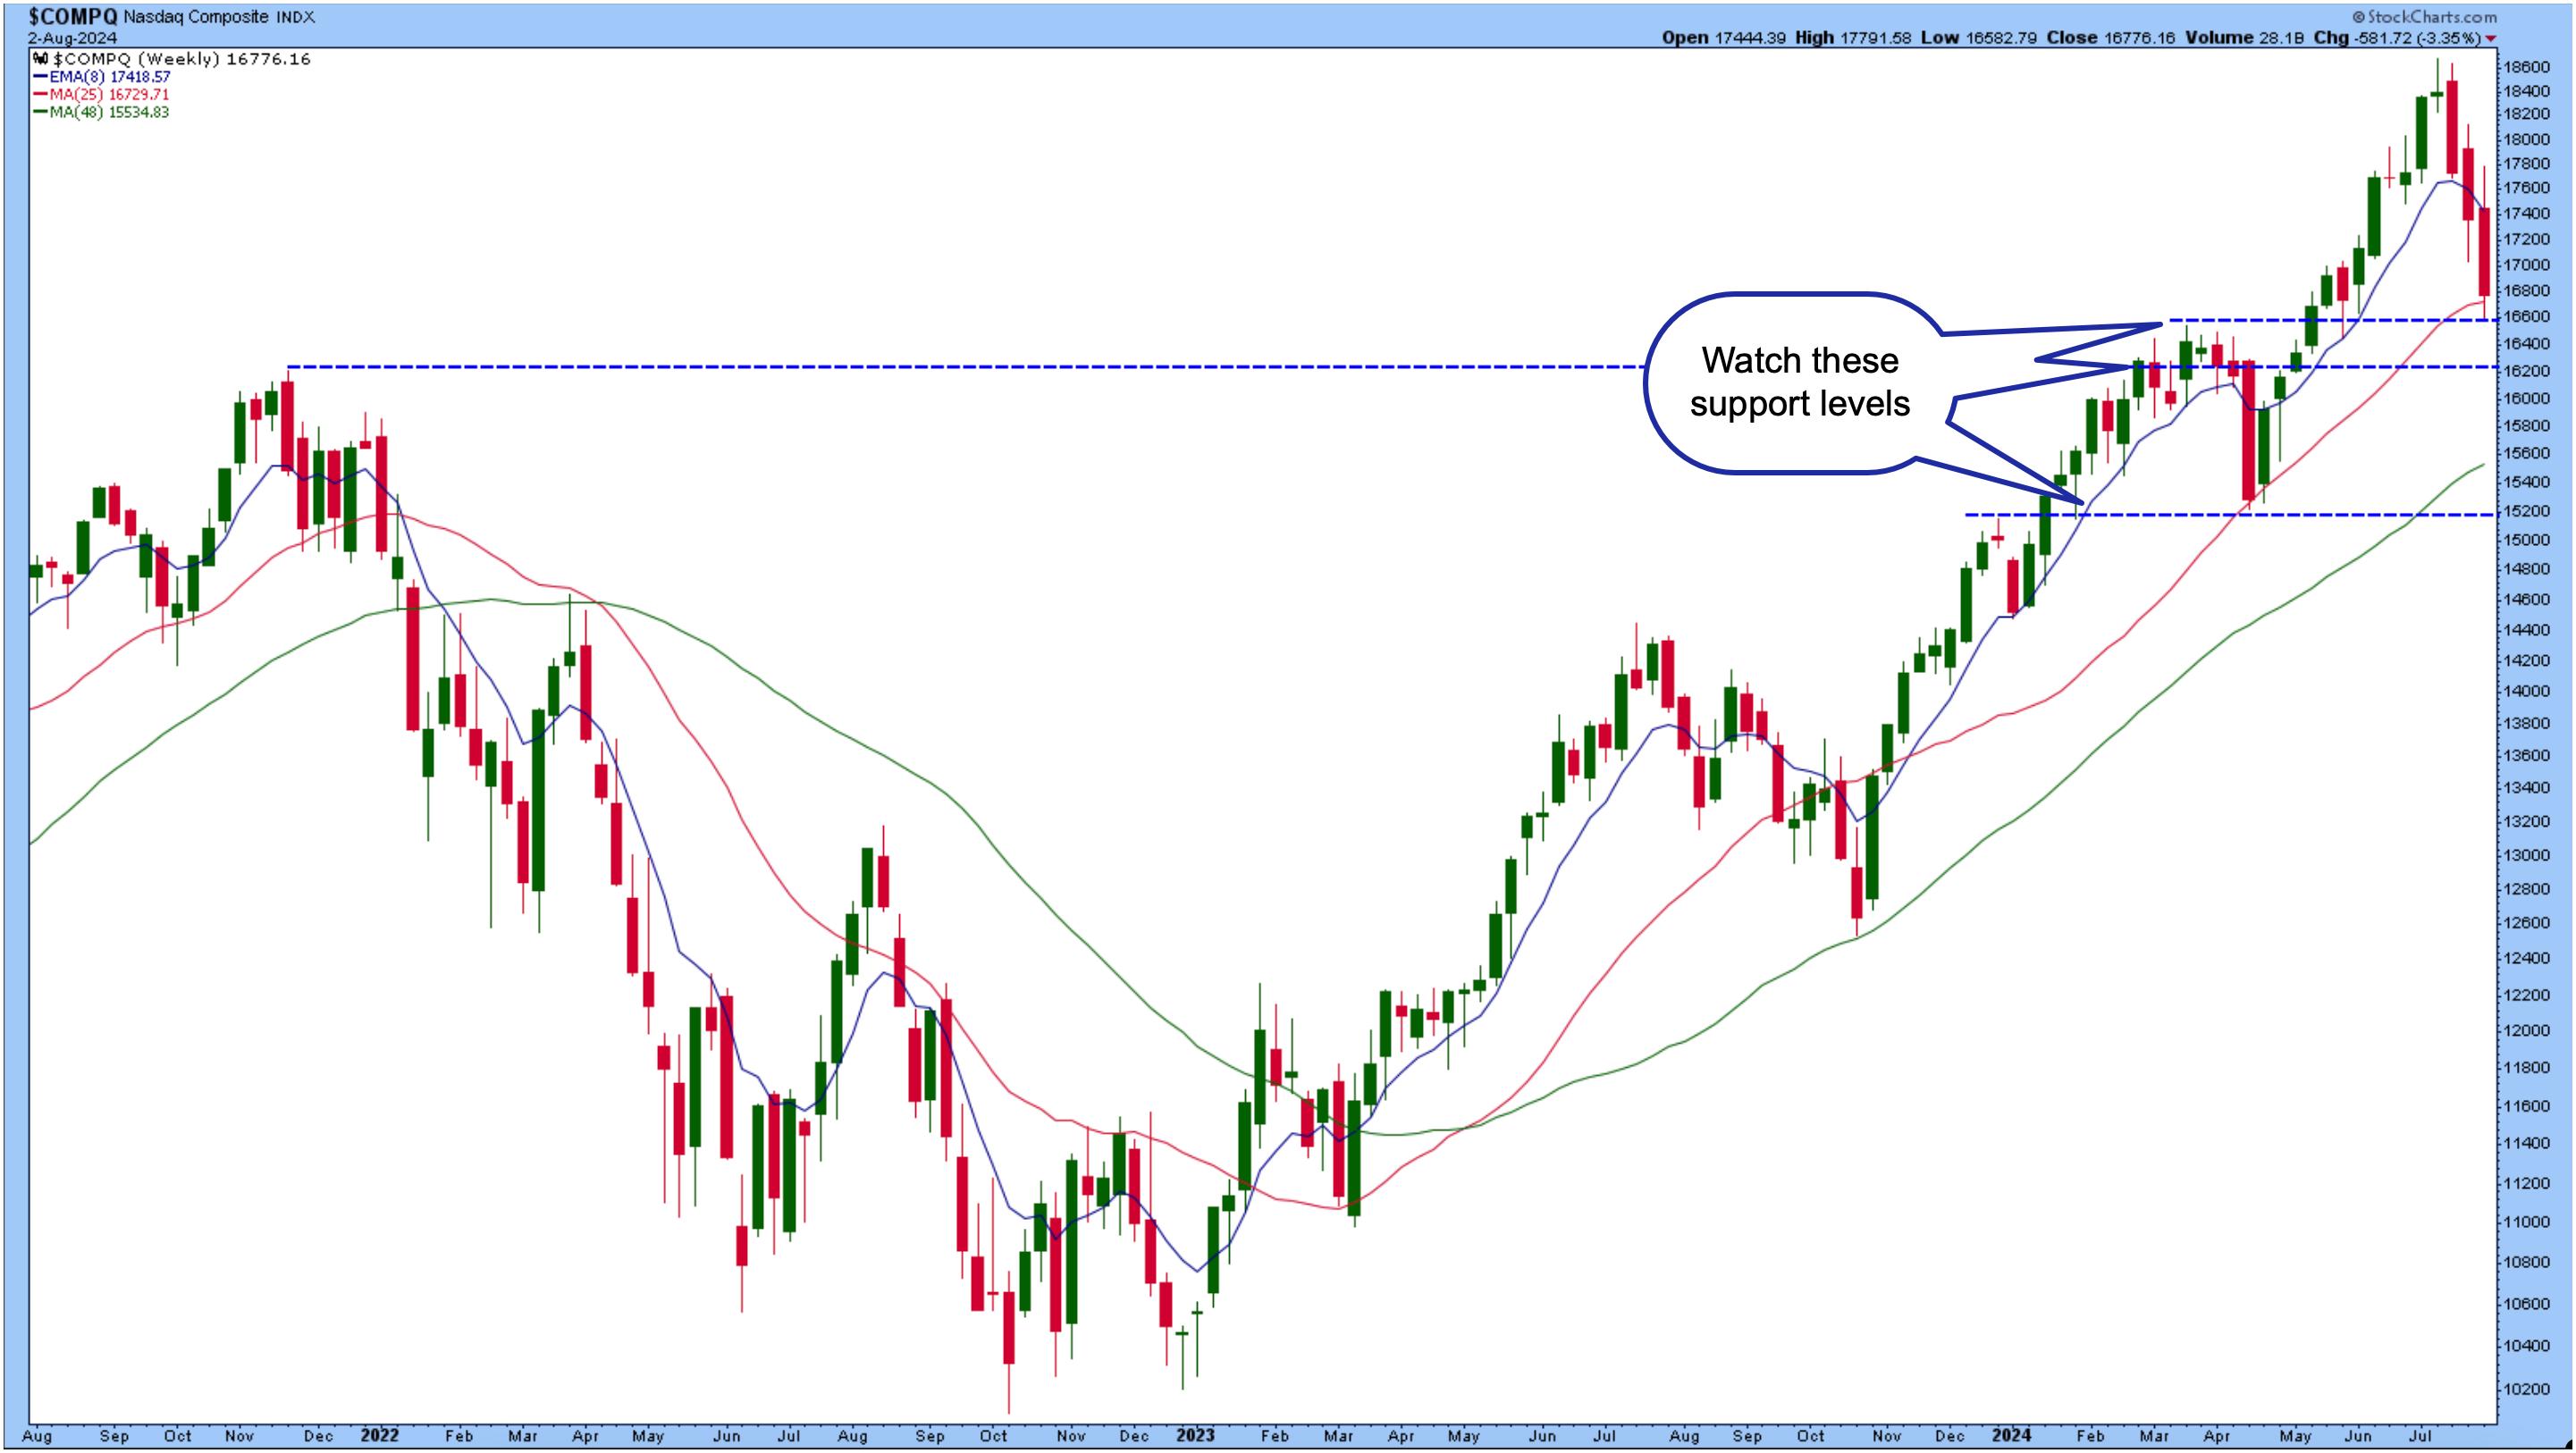
CHART 3. WEEKLY CHART OF NASDAQ COMPOSITE. Keep an eye on some key support levels. Chart source: StockCharts.com. For educational purposes.
The daily chart below suggests that the index is likely to reach its April lows—almost a 20% move from the high. If tech company earnings follow the trend of either weak guidance or lower-than-expected earnings reports, the Nasdaq could take a deeper dive.
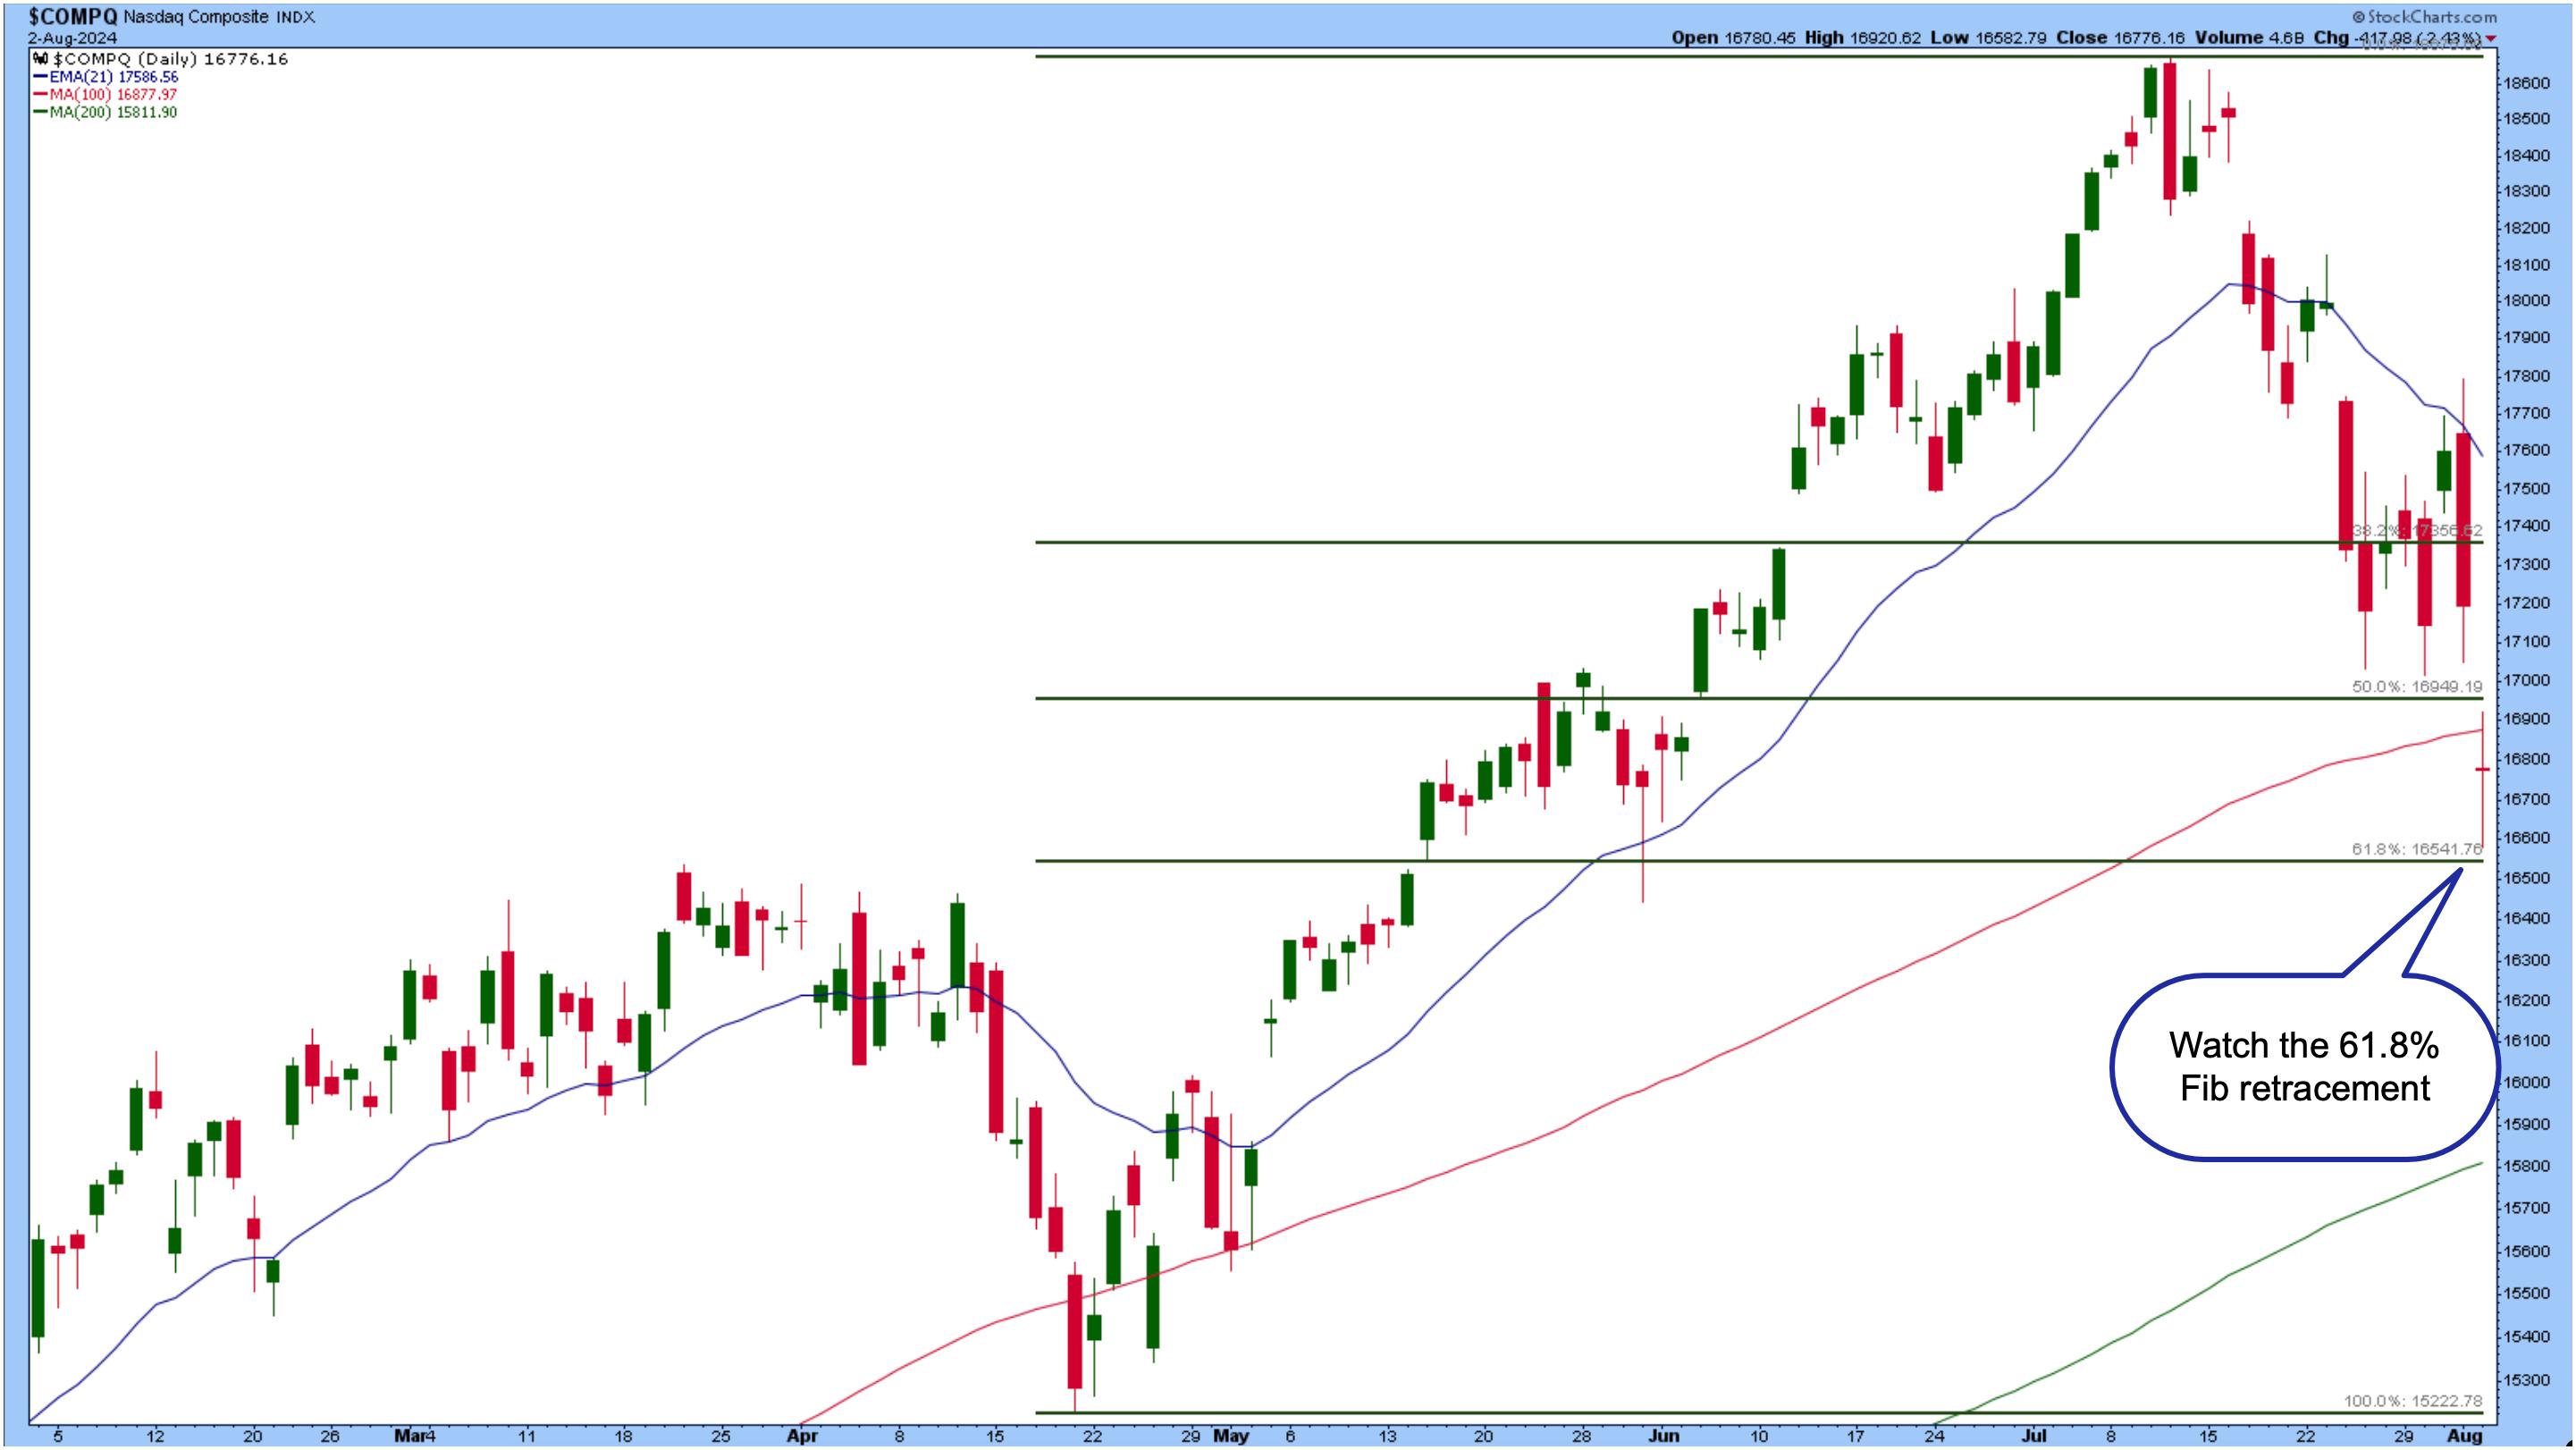
CHART 4. NASDAQ COMPOSITE ALMOST AT A 61.8% FIBONACCI RETRACEMENT. The tech selloff could continue, so keep an eye on the next support levels. Chart source: StockCharts.com. For educational purposes.
Bonds Step Up
If investors are pulling money out of stocks, where is the money going? Could it be bonds? Maybe. Bonds were one of the bright spots on Thursday. The weekly chart of the iShares 20+ Year Treasury Bond ETF (TLT) below shows that bonds broke out on strong momentum on Friday. If you're sitting on some cash, it may be time to allocate a portion of your portfolio to bonds.
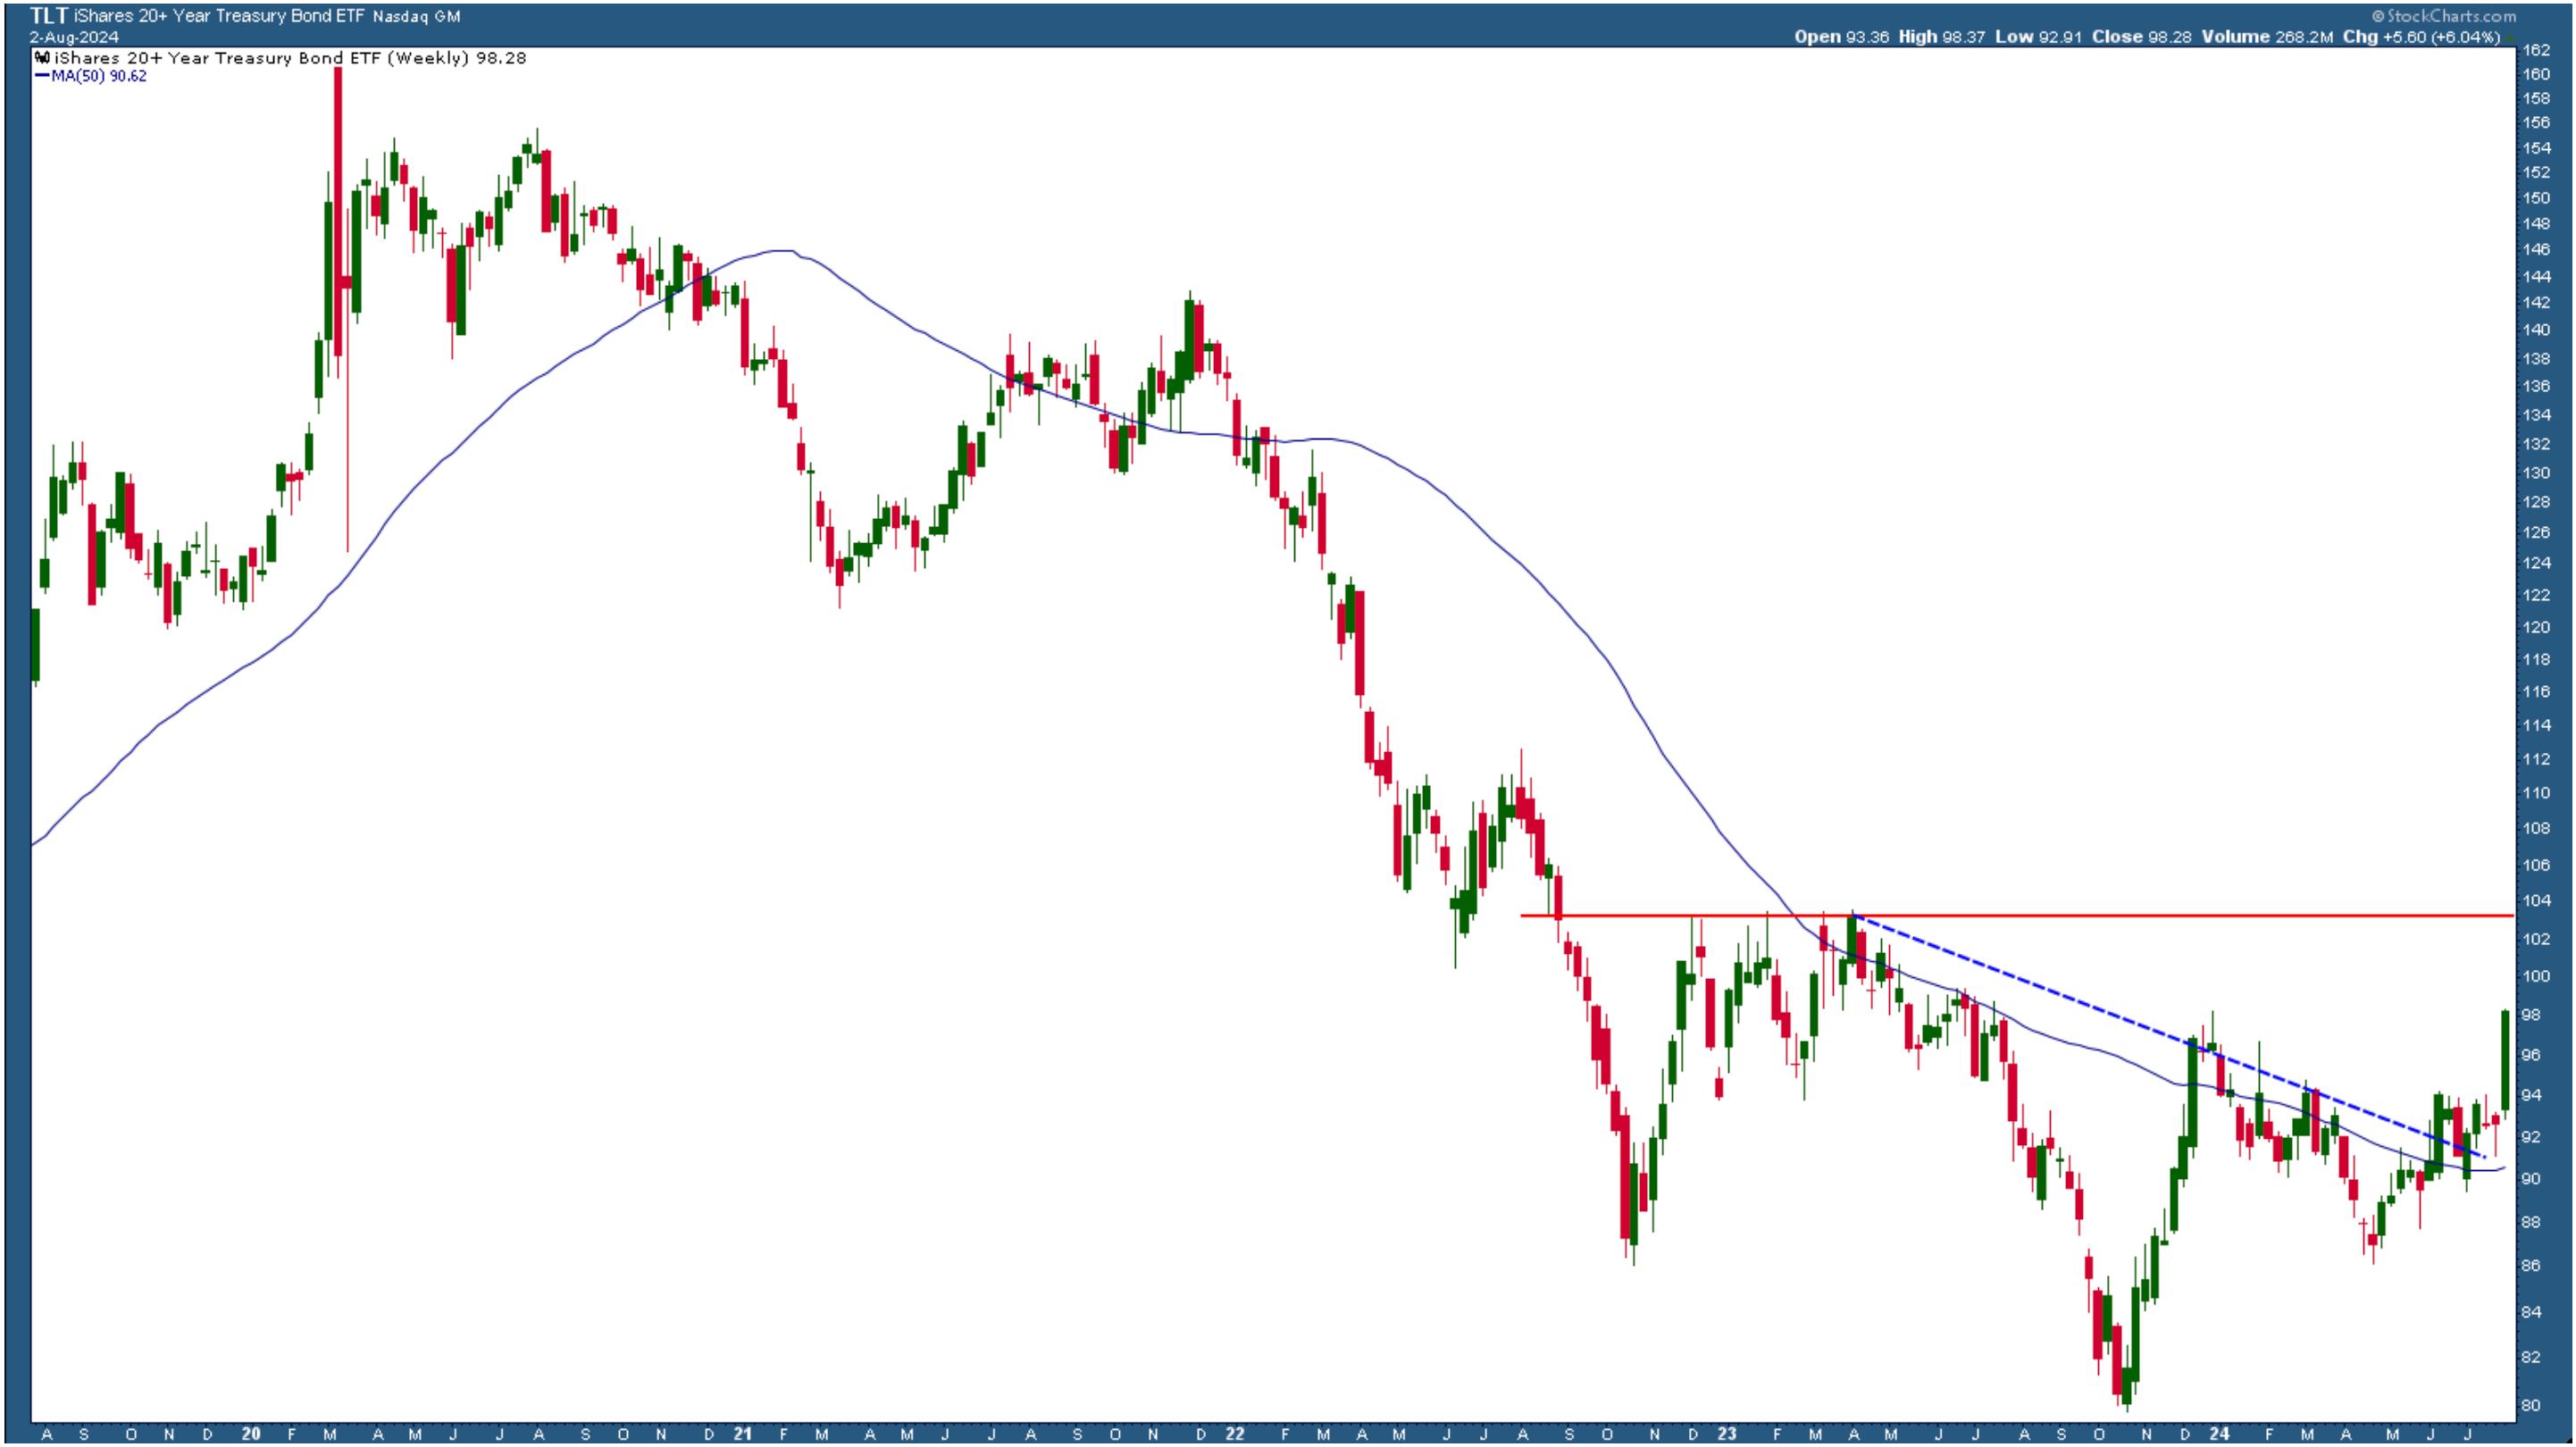
CHART 5. WEEKLY CHART OF TLT. Bond prices have broken out to the upside. This could be the time to pay attention to bonds. Chart source: StockCharts.com. For educational purposes.
As the stock market indexes dropped, the Cboe Volatility Index ($VIX) spiked. On Friday, the VIX almost hit 30 but closed below the high. Talk about a panic rise!
Closing Position
Overall, August started badly. This is a difficult market for long-term investors. Should you wait it out or sell your long equity positions and park some of your cash in bonds? It's best not to focus on all the noise and stop worrying about the day-to-day moves. But you should still monitor important support and resistance levels.
Another point to remember is that we're amid a seasonally weak period, which tends to be more pronounced during an election year. Let's hope we'll get out of this in September without too much damage and perhaps a 50 basis point rate cut.
End-of-Week Wrap-Up

- S&P 500 closed down 2.06% for the week, at 5346.56, Dow Jones Industrial Average down 2.10% for the week at 39,737.26; Nasdaq Composite closed down 3.35% for the week at 16776.16
- $VIX up 42.71% for the week closing at 23.39
- Best performing sector for the week: Utilities
- Worst performing sector for the week: Technology
- Top 5 Large Cap SCTR stocks: Carvana Co. (CVNA); Insmed Inc. (INSM); MicroStrategy, Inc. (MSTR); Alnylam Pharmaceuticals, Inc. (ALNY); Ryan Specialty Group Holdings, Inc. (RYAN).
On the Radar Next Week
- July ISM Services PMI
- August 30-Year Mortgage Rates
- June Consumer Credit Change
- July Manufacturing PMI
- Fed speeches from Daly and Barkin
- Earnings from Lucid Group (LCID), Caterpillar Inc. (CAT), Gilead Sciences (GILD), Robinhood Markets, Inc. (HOOD), Palantir Technologies, Inc. (PLTR), and many more.
Disclaimer: This blog is for educational purposes only and should not be construed as financial advice. The ideas and strategies should never be used without first assessing your own personal and financial situation, or without consulting a financial professional.
Happy charting!


