TAKEAWAYS
- One sector ETF is slightly outperforming the S&P 500 while the rest are underperforming the index.
- The performances of the four outperforming sector ETFs from September to December vary.
- Check the price action and fundamentals to see if both might agree with each sector's seasonal tendencies.

Seasonality is like a second opinion from a wise friend who knows something about the market's historical tendencies. While you're weighing current price action against the fundamental dynamics of the environment, seasonality tells you what things have typically gone on, by how much, where they've happened, and when they tend to happen. It's a secondary context.
So, relative to the S&P 500 ($SPX), what might history reveal about seasonal sector performance from September to the end of the year?
Top Four Outperforming Sectors Relative to the S&P
Looking at all 11 S&P sectors' performance against the S&P 500 over the last 10 years, four stand out for September through December—Financial, Industrial, Energy, and Materials. Let's dive into the S&P Sector ETFs that represent these sectors.
Financial Select Sector SPDR Fund (XLF)
- 73% average higher-close rate
- 4.7% cumulative seasonal return
- Dividend 1.52%
Seasonality-wise, XLF is the strongest performer, with average returns and higher-close rates rising from September through November (see chart below).

CHART 1. 10-YEAR SEASONALITY CHART OF XLF VS S&P. Note the positive months of September through November.
Looking at XLF's daily chart below, it broke above $42.50, catapulting into all-time high territory. Buying momentum, based on the Chaikin Money Flow (CMF) reading, appears to be increasing. Currently, XLF is barely outperforming the S&P 500 by over 3%. If the seasonality projections remain consistent, XLF may be headed for a breather before ending the year with a strong rally.
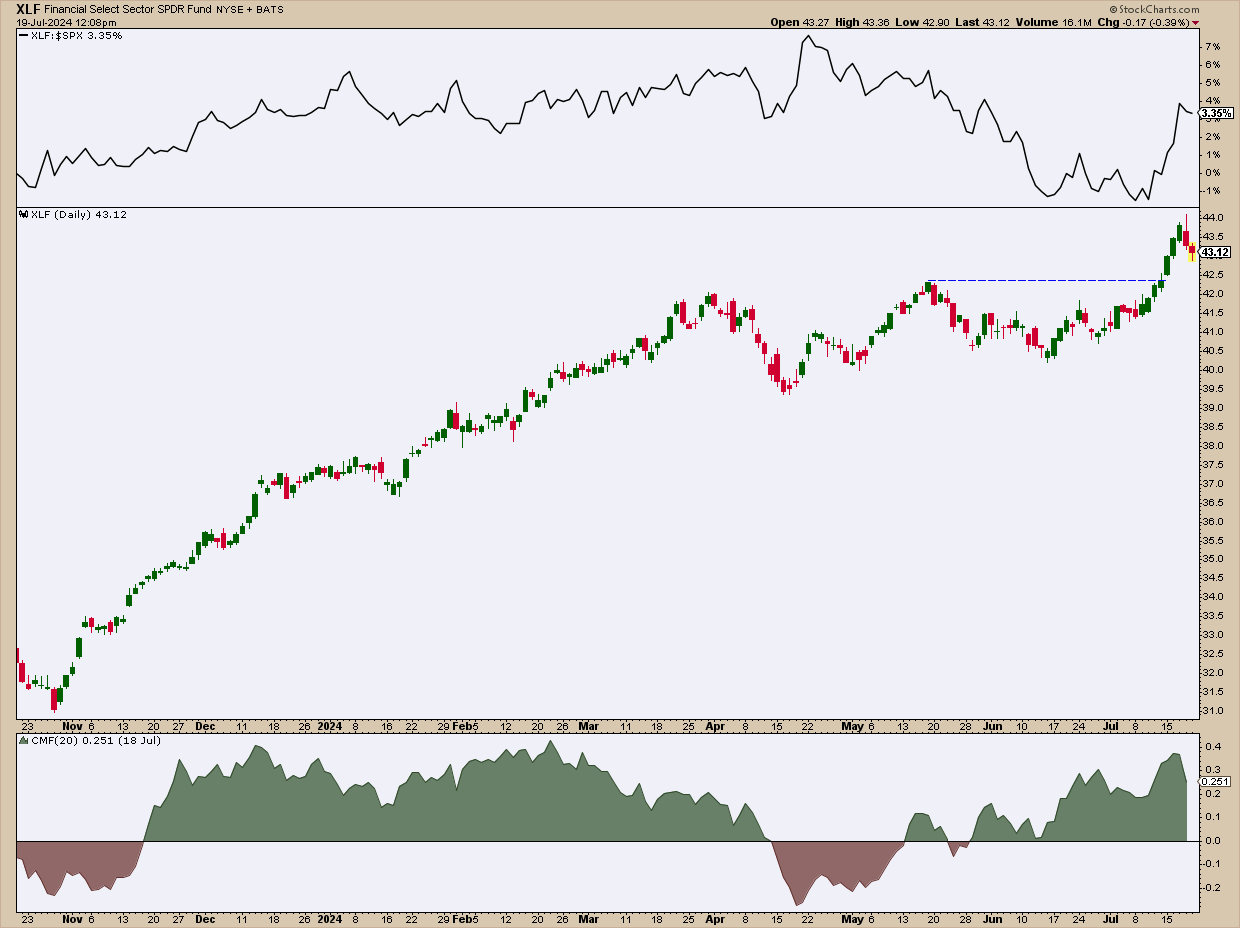
CHART 2. DAILY CHART OF XLF. The ETF launched into all-time highs but has pulled back since then.
Industrial Select Sector SPDR Fund (XLI)
- 56% average higher-close rate
- 2.2% cumulative seasonal return
- Dividend 1.47%
The Industrial sector has two months of seasonal strength and weakness. The strongest month, November, sees a 78% higher close rate relative to the S&P 500 and a 1.8% average return (see chart below).

CHART 3. 10-YEAR SEASONALITY CHART OF XLI VS S&P 500. Note the two strong months and December's negative average.
Looking at XLI's daily chart below, it broke above $126 into all-time high territory. Unlike XLF, it's underperforming the S&P 500 by just over -1%. However, the buying pressure appears to be dwindling, so maybe the August seasonal weakness will materialize this year. If it does, that might present a buying opportunity for investors looking to get into a position. Additionally, watch for instances where decreasing momentum foreshadowed pullbacks.
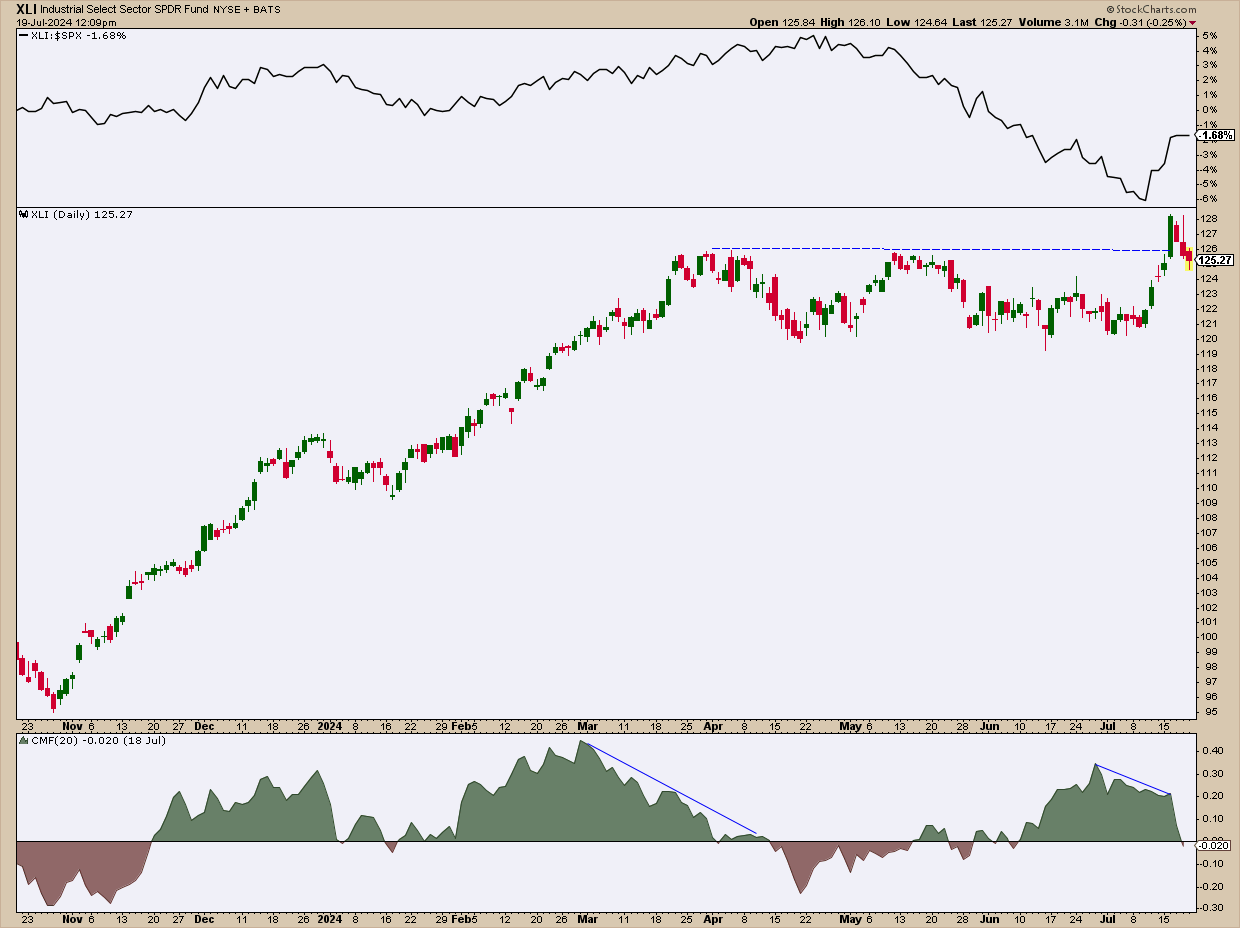
CHART 4. DAILY CHART OF XLI. Most of the time, buying/selling pressure was an indicator of pullbacks and rallies.
Energy Select Sector SPDR Fund (XLE)
- 42% average higher-close rate
- 2.1% cumulative seasonal return
- Dividend 3.18%
September is the Energy sector's strongest month against the S&P 500 for the second half of the year (see chart below). From that point on, the seasonal returns become increasingly negative, and the higher-close rate falls under 50%.

CHART 5. 10-YEAR SEASONALITY CHART OF XLE vs. S&P 500. Most positive returns in the latter half tend to be made in September and October.
Looking at XLE's daily chart, it's clear that momentum (see blue rectangle) has decreased and shows no sign of directionality. XLE is underperforming the S&P 500 by a whopping -19%, but what's fueling the rally? If XLE surpasses the resistance level of $92.50, it will be important to monitor the subsequent three resistance levels (all swing highs). Remember the seasonal pattern, where September has historically provided the highest returns, but a negative trend emerges toward the end of the year.
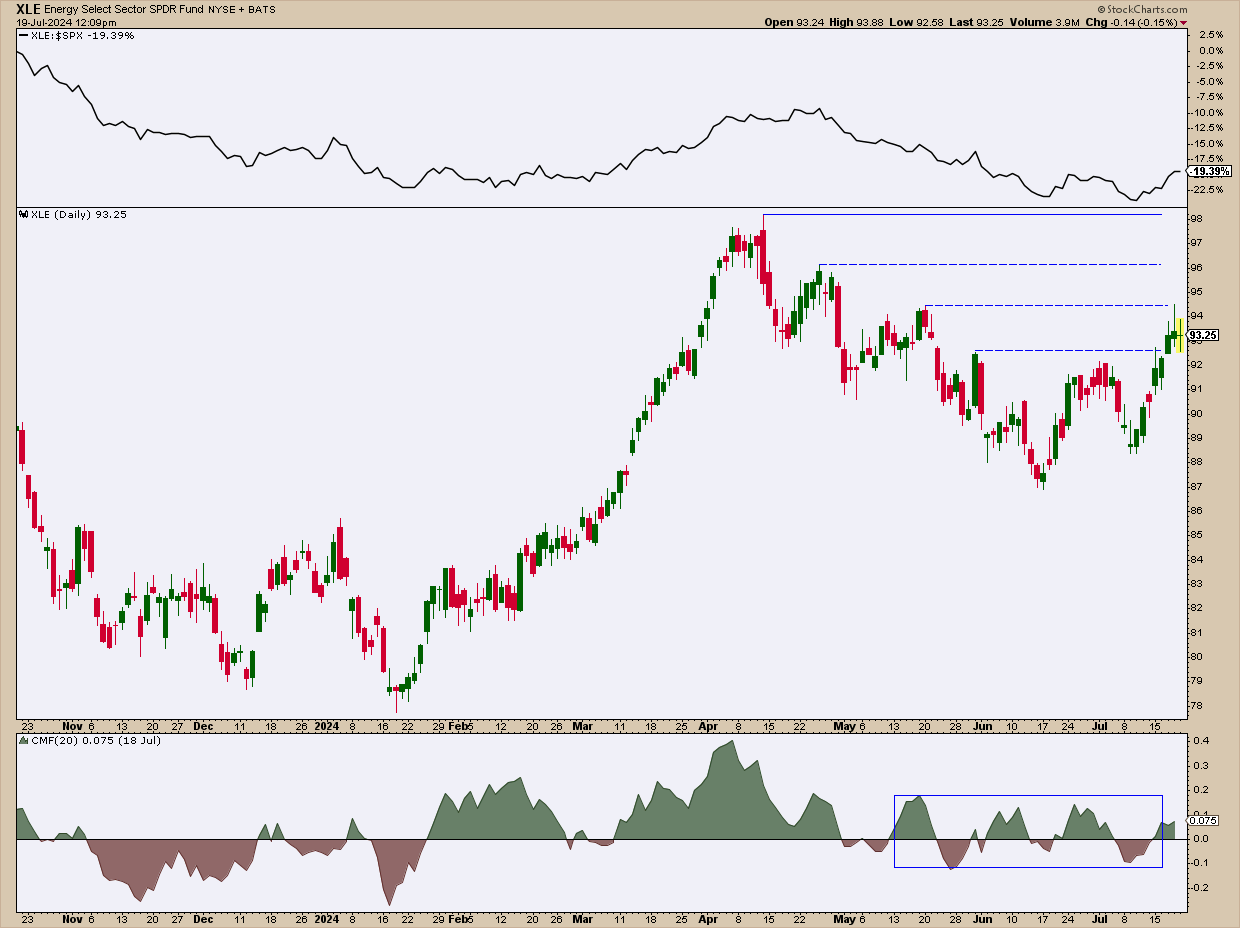
CHART 6. DAILY CHART OF XLE. Is the momentum sputtering?
Materials Select Sector SPDR Fund (XLB)
- 62% average higher-close rate
- 1.9% cumulative seasonal return
- Dividend 1.93%
Materials' higher-close rates from September to December are high, but the returns (again, relative to the S&P 500) are generally low. November shows the most favorable month, seasonality-wise (see chart below).
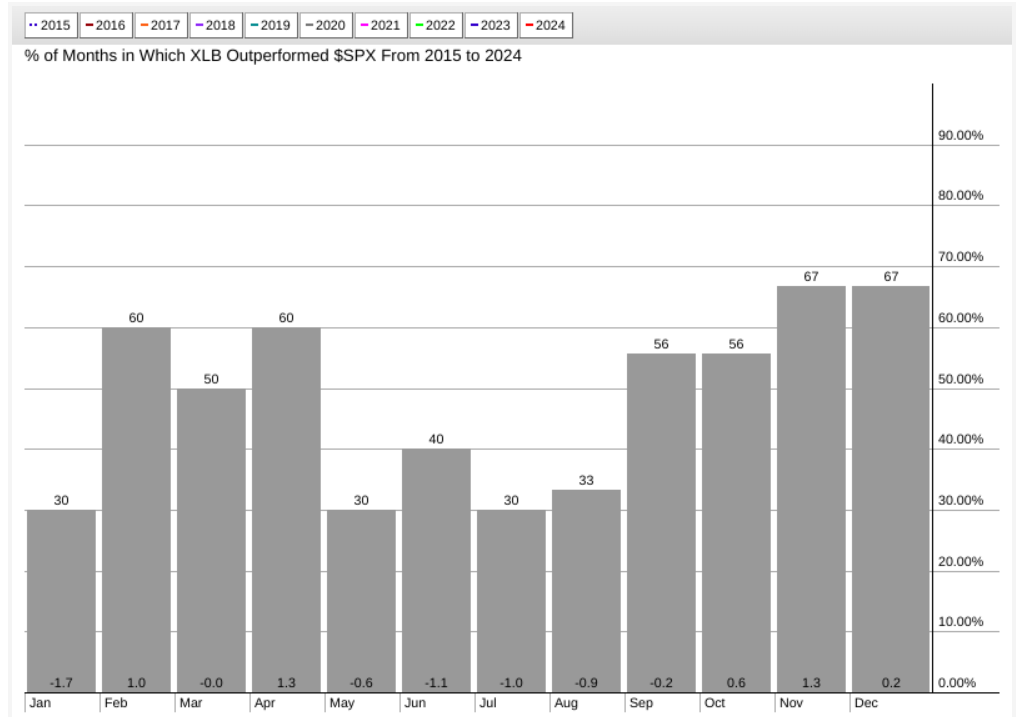
CHART 7. 10-YEAR SEASONALITY CHART OF XLB vs. S&P. Regarding the higher-close rates, the last four months of the year tend to be steady, though the average returns fluctuate.
Looking at the XLB chart below, the ETF has two levels of resistance before launching into an all-time high. XLB is challenging the first level, $92. To establish a record high, XLB must surpass the second level, $93.
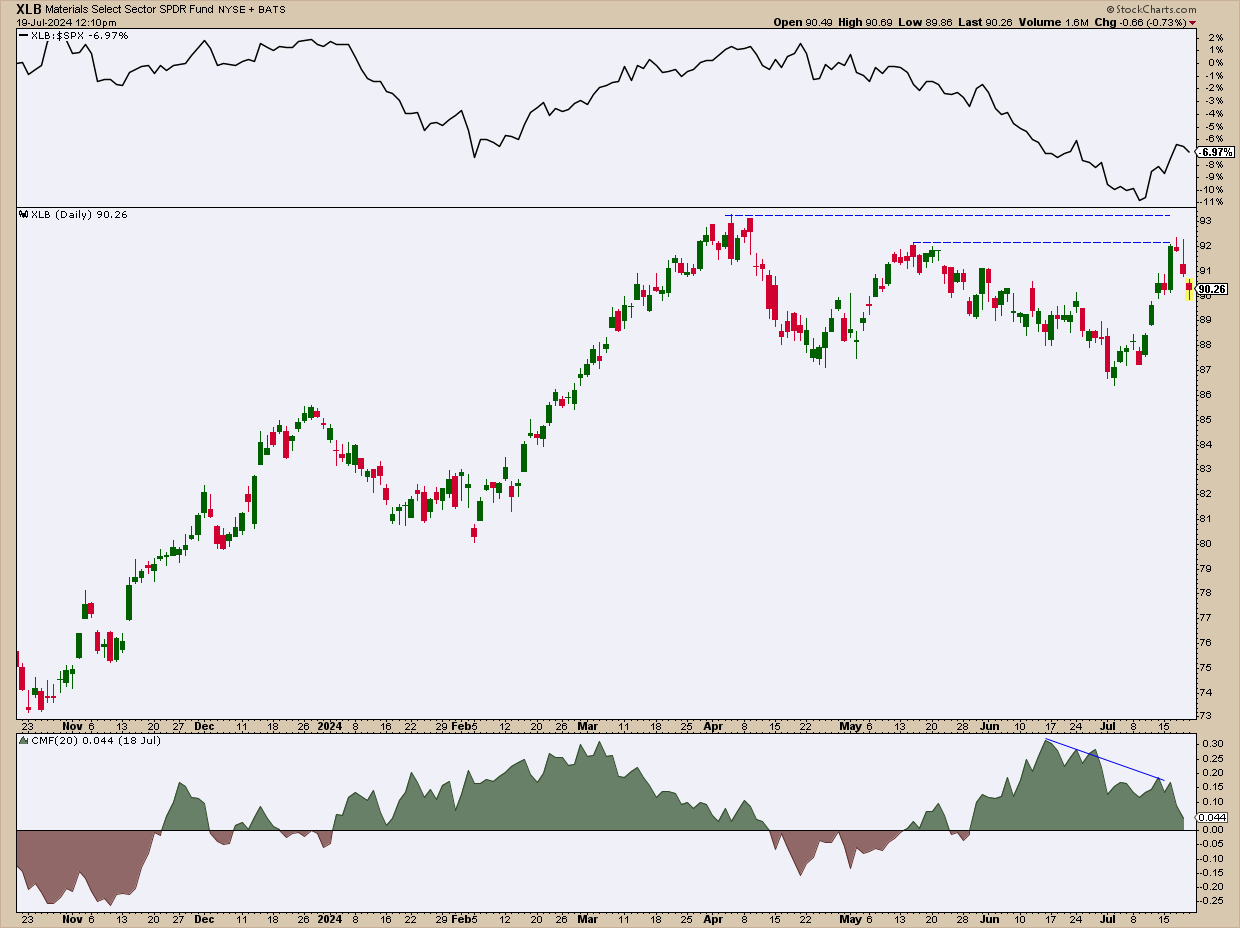
CHART 8. DAILY CHART OF XLB. The ETF has to break above two resistance levels before entering record-high territory.
Buying pressure appears to be slowing, but seasonality-wise, you might expect weakness in August and September (despite the latter's higher closing rates) before anticipating steady performance until the end of the year.
At the Close
Seasonality can feel like a historical cheat sheet. The most favorable picks for September to December? XLF, XLI, XLE, and XLB tend to perform well relative to the S&P 500 during this specific seasonal period. But hold up—before diving in, check the technicals and fundamentals. Seasonality is a great guide, but a complete picture is key for making smarter investing decisions.

Disclaimer: This blog is for educational purposes only and should not be construed as financial advice. The ideas and strategies should never be used without first assessing your own personal and financial situation, or without consulting a financial professional.
Happy charting!


