TAKEAWAYS
- Stock market sees rally in areas aside from the Magnificent Seven stocks
- Small-cap stocks had an impressive performance in the last two trading days of the week
- The stock market continues to show its bullish strength as we enter earnings season

What a strange trip it's been!
After breaking out of its June 20 to July 3 sideways movement, the S&P 500 ($SPX) index finally broke out to the upside--until it didn't. That was on Thursday.
Friday was a different story.
After Thursday's CPI report, the stock market reacted in a way that suggested investors were rotating out of tech stocks into other areas of the stock market. Could this have been a knee-jerk reaction to the cooler inflation data, combined with the market historically performing well during the first two weeks of July? Or was it something else? Whatever the case, it didn't last long, which seems to be the stock market's most typical behavior of late. Reactions tend to be big, but only last a day or two.
This type of environment makes it more difficult for retail traders since it's easy to get sucked into what others are thinking. That's why it's so important to look at the big picture before following the crowd. Remember, there are more algorithms making decisions. This is evident in how the stock market did a complete switcheroo on Friday.
The producer price index (PPI) number was slightly higher than estimates. This led to a 180-degree turn in market sentiment as onvestors returned to large-cap stocks. However, what was different about Friday's stock market price action was that it wasn't just the Mag 7 stocks that saw upside movement. The S&P 500 Equal Weighted Index ($SPXEW) broke out of its triangle pattern, piercing through the upper boundary. Small- and mid-cap stocks also rose. And the good ol' Dow Jones Industrial Average ($INDU) hit an intraday record high, but couldn't hang on to it high at the close. The same goes for the S&P 500 and Nasdaq Composite ($COMPQ).
Macro View Of the Stock Market
So, the rotation is still in play, and the trading week ends with participation broadening out to different areas of the market. That Thursday's selloff didn't continue into Friday shouldn't be too surprising, given the CBOE Volatility Index ($VIX) is still at relatively low levels.
The bullish sentiment is still intact, as seen by the expansion of market breadth. The daily chart of the S&P 500 below includes the NYSE new 52-week highs and lows in the lower panels.
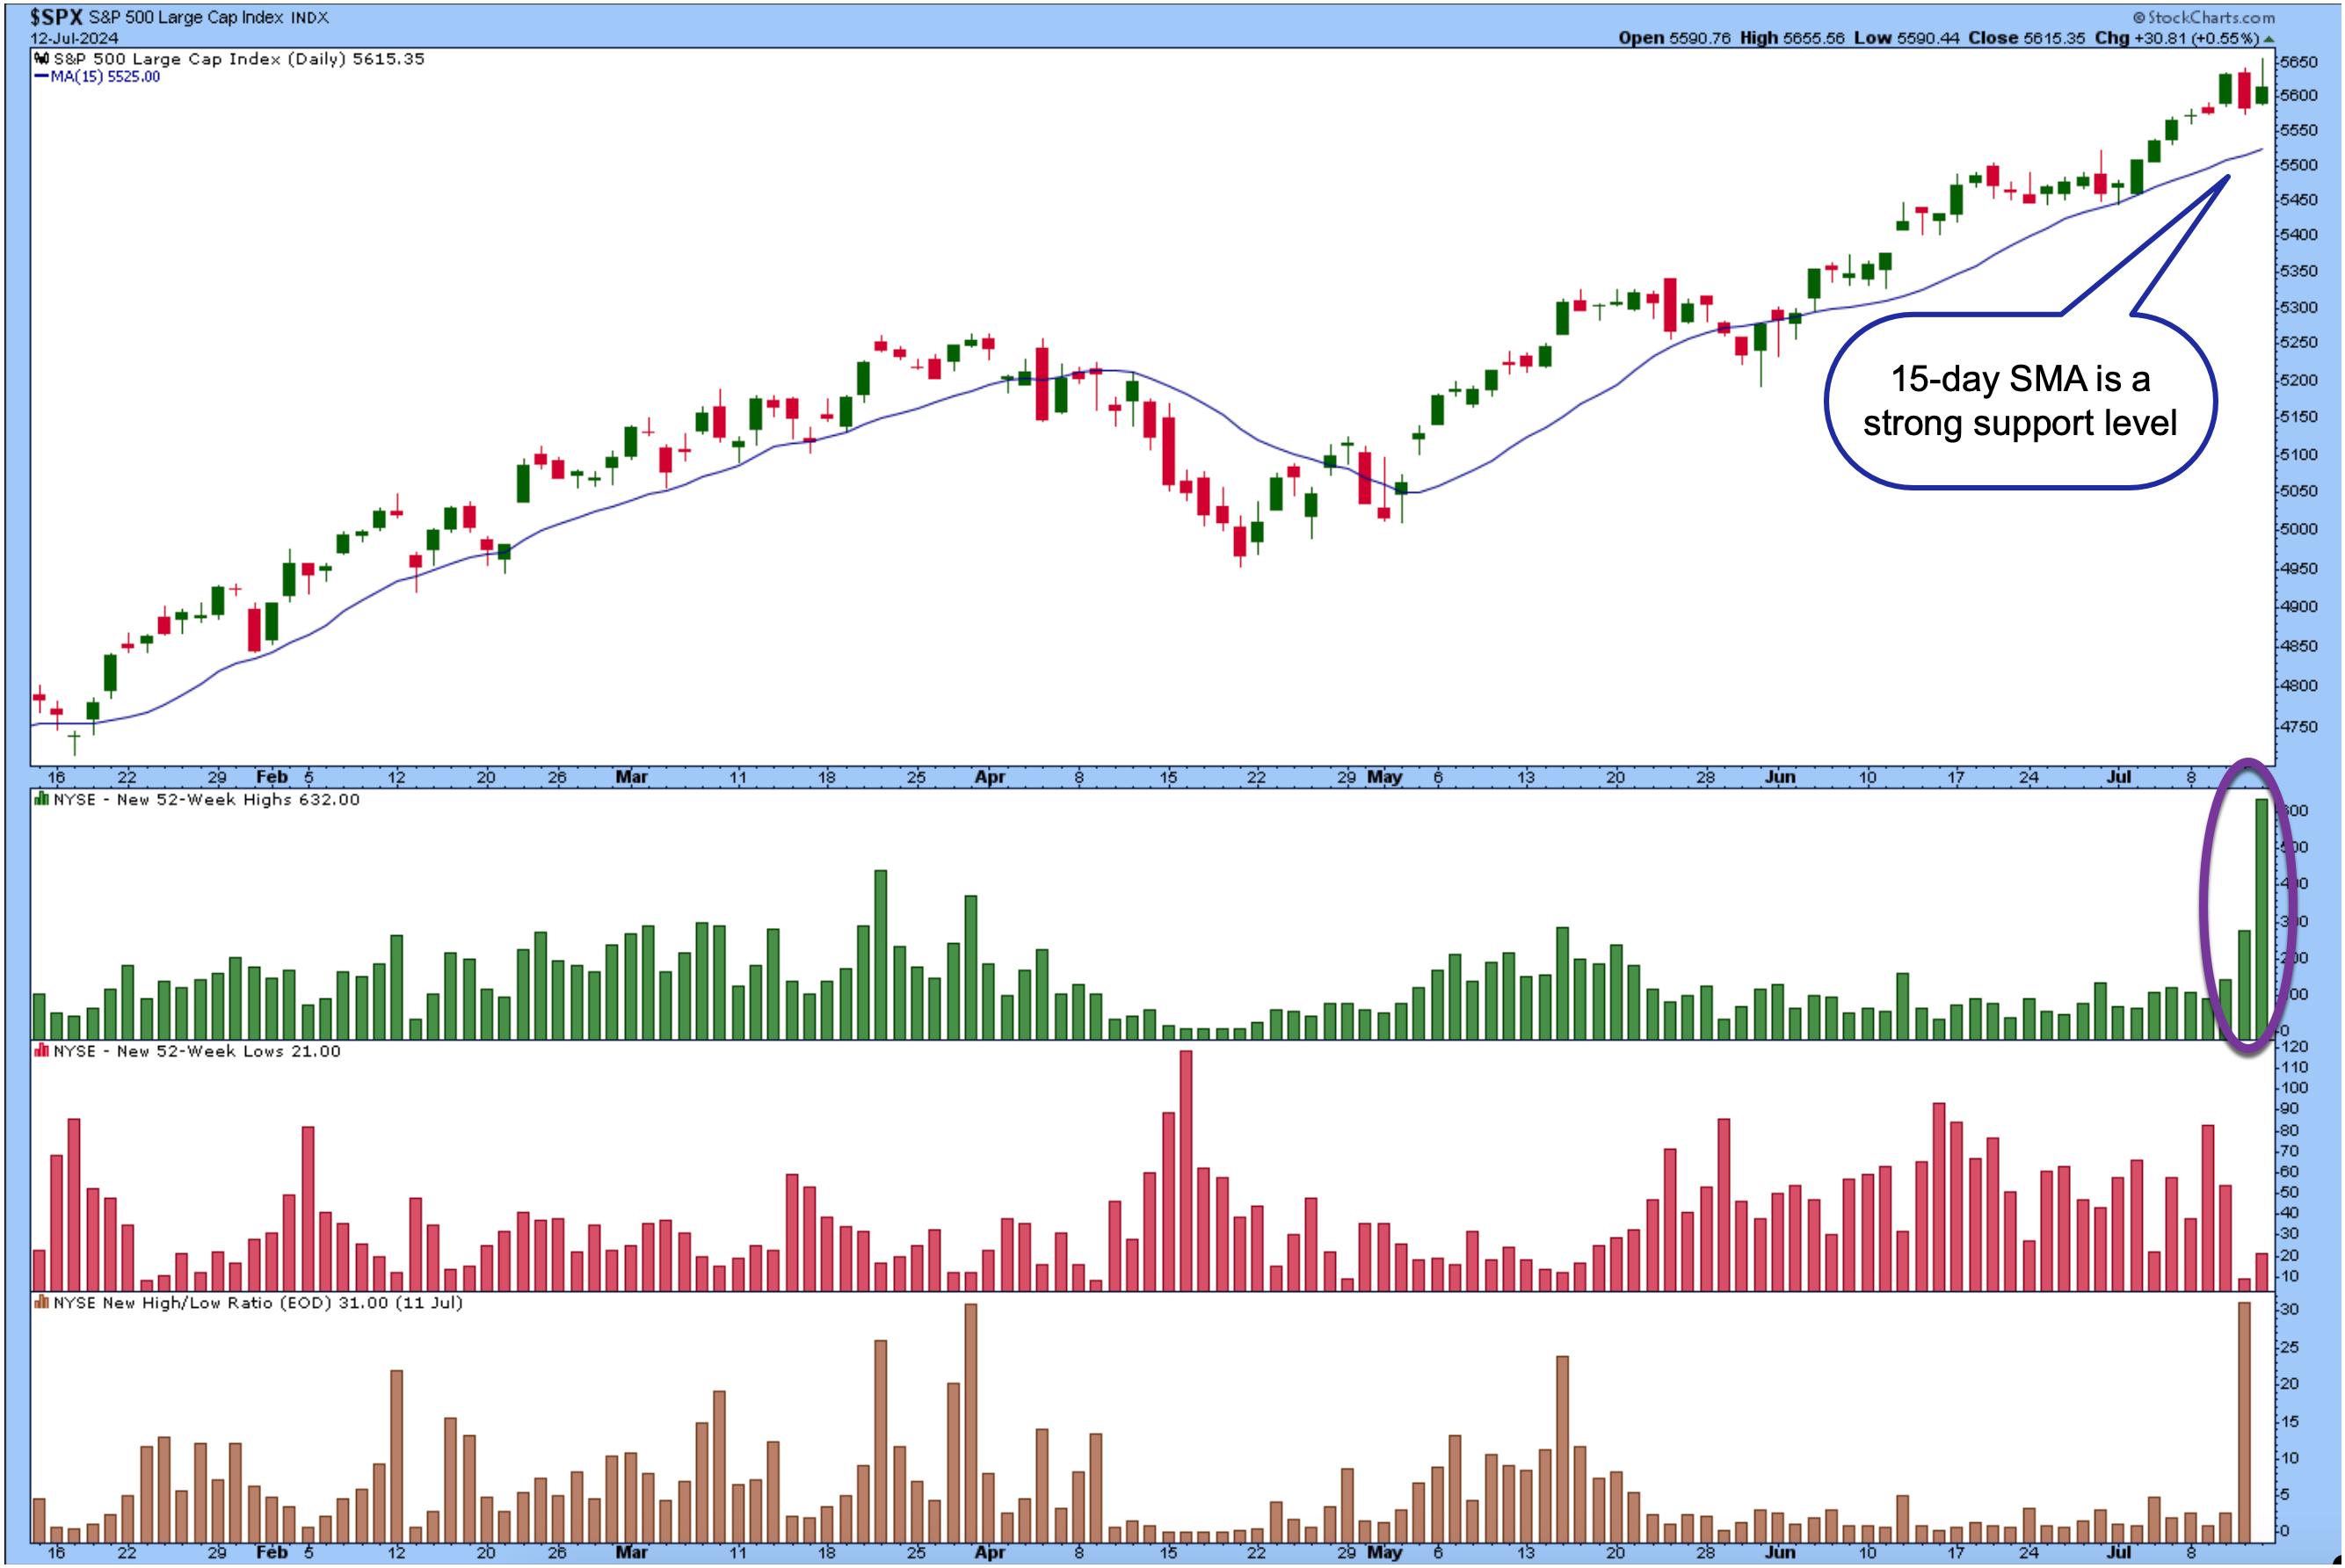
CHART 1. S&P 500 INDEX BREADTH. The new 52-week highs indicator has been expanding for the last three days.Chart source: StockCharts.com. For educational purposes.
Note that the number of new 52-week highs has expanded in the last three days. On Thursday, when equities went through a big selloff, the number of NYSE new 52-week highs increased, indicating money was still flowing into equities. It may not have been coming into tech stocks, but it was going somewhere.
The 15-day simple moving average (SMA), a reliable support level since June, indicates that the equities trend is still bullish.
If market breadth expands and the overall trend increases, there's no reason to panic sell. It's true that, historically, the stock market performs well during the first two trading weeks of July and slows down during the second two weeks of the month. But, at this point, it's best to go with the flow, which currently looks like the trend—despite short-term turbulence—is up.
Small Cap Stocks Are Taking Off
The action in small-cap stocks is particularly interesting. The S&P 600 Small Cap Index ($SML) has broken above a strong resistance level with expanding breadth (see chart below).
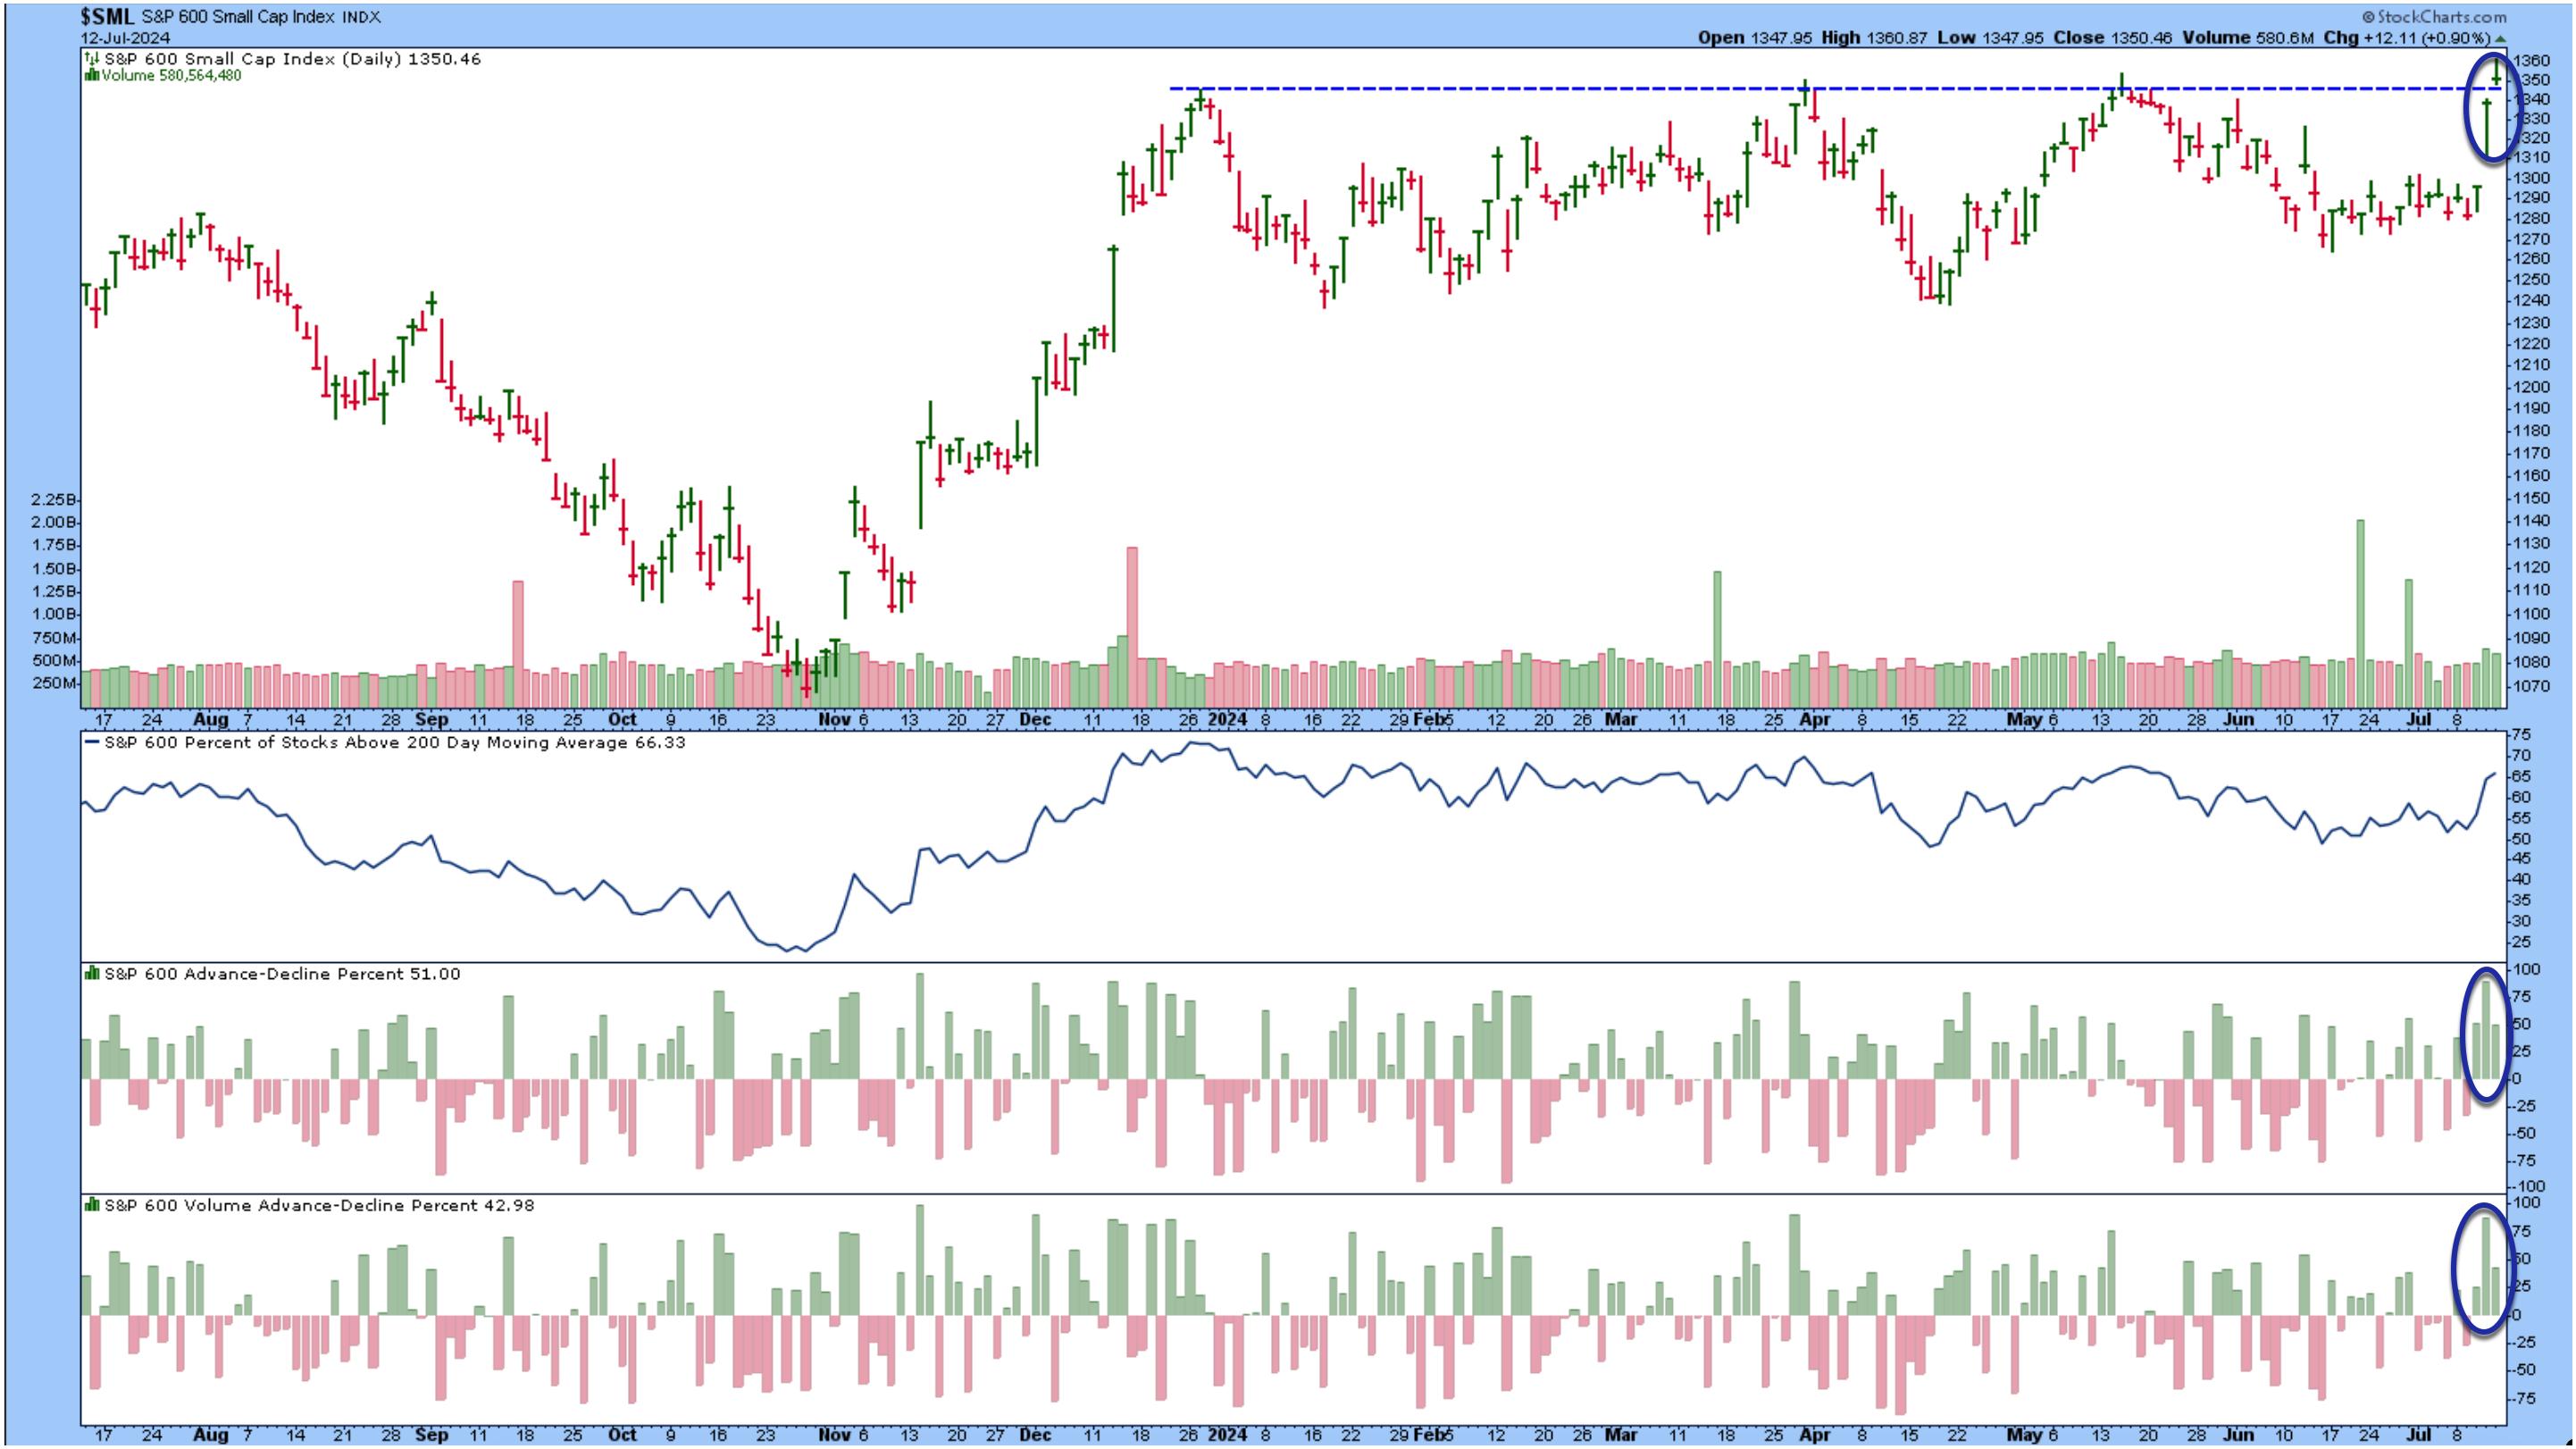
CHART 2. S&P 600 SMALL CAP STOCKS. Small-caps were in the spotlight in the last two days of the trading week. Market breadth expanded significantly. Will there be a follow-through next week?Chart source: StockCharts.com. For educational purposes.
The percentage of S&P 600 stocks trading above their 200 day moving average is above 66%, while the Advance-Decline Percent and Advance-Decline Volume Percent have been in positive territory for the last three trading days.
The bottom line: The broader stock market indexes are trading at or close to all-time highs, small-caps are breaking above a resistance level, and volatility is at relatively low levels. These are all positives for the financial market until signs show otherwise.
Earnings Season Kicks Off
Earnings season kicked off on Friday with JP Morgan Chase (JPM), Citigroup (C), and Wells Fargo (WFC) reporting. Investor reaction was mixed even though all three beat estimates. JPM's stock price closed lower by 1.21%, C declined by 1.80%, and WFC was the worst performer in the S&P 500, its stock price declining almost 6%.
Next week is thin on US economic data. The focus will be more on earnings, with mostly banks and energy companies reporting. The market seems to be shifting its behavior, so it's important to focus on the price action and act accordingly. It's difficult in the summer months when everyone likes to take vacations; we're trying to make it easier for you by sharing our charts. So make sure to click on the live charts and add them to your ChartLists!
End-of-Week Wrap-Up

- S&P 500 closed up 0.87% for the week, at 5615.35; Dow Jones Industrial Average up 1.59% for the week at 40,000.90; Nasdaq Composite closed up 0.25% for the week at 18,398.45
- $VIX down 3.56% for the week closing at 12.46
- Best performing sector for the week: Real Estate
- Worst performing sector for the week: Communication Services
- Top 5 Large Cap SCTR stocks: Insmed Inc. (INSM); Carvana Co. (CVNA); Super Micro Computer, Inc. (SMCI); NVIDIA (NVDA); MicroStrategy, Inc. (MSTR)
On the Radar Next Week
- June Retail Sales
- Earnings from BlackRock Inc. (BLK), Goldman Sachs (GS), Bank or America Corp (BAC), Charles Schwab Corp. (SCHW), Netflix (NFLX), Alcoa Corp. (AA), Haliburton Co. (HAL), and Schlumberger NV (SLB), among many other companies
- Fed speeches from Chairman Powell, Daly, Kugler, and others
- July MBA 30-year Mortgage rate
- June Housing Starts
- June Industrial Production
Disclaimer: This blog is for educational purposes only and should not be construed as financial advice. The ideas and strategies should never be used without first assessing your own personal and financial situation, or without consulting a financial professional.
Happy charting!


