TAKEAWAYS
- Financials typically struggle in September, but tend to rally in Q4.
- XLF has broken into all-time high territory, but its momentum is fading.
- If XLF dips in September, it could present a buying opportunity.
 Financial sector stocks are at an all-time high, fueled partly by earnings beats, a favorable and higher interest rate environment, and sector sentiment. Investors are seeing value buying opportunities in many beaten-down financial stocks. Should you follow their lead?
According to Fed Chief Powell's latest remarks, rate cuts are on the horizon. Lower interest rates can cut both ways, narrowing net interest margins and pressuring bank earnings while boosting the broader market and lifting stocks, including financials.
When navigating such fundamental uncertainty, it helps to step back and consider the broader patterns at play. Consider seasonal trends and how technical price action might inform your short-term strategy. Let's start with seasonality.
5-Year Seasonality Chart of XLF
The StockCharts seasonality chart can help you identify how XLF performs each month and the average price change (see below).
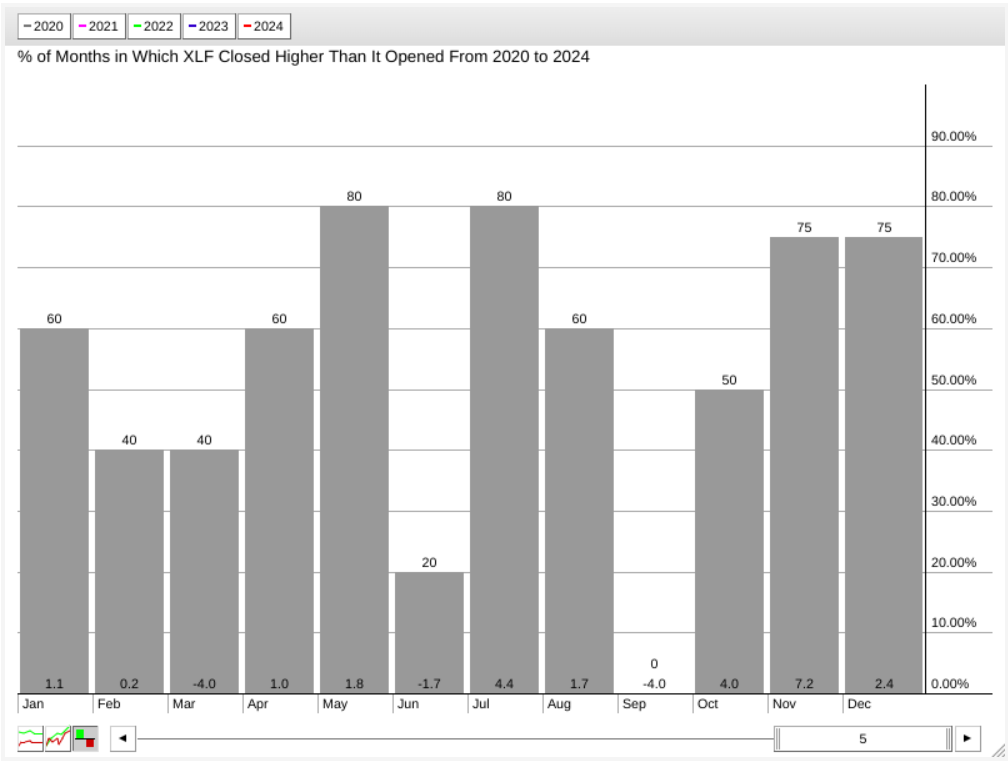
CHART 1. FIVE-YEAR SEASONALITY PROFILE FOR XLF. Note September's negative performance.Chart source: StockCharts.com. For educational purposes.
The numbers above the bar signify the percentage of higher closes. The numbers at the bottom of each bar signify the average % return for the time period being analyzed -- in this case, five years.
Key points from the XLF seasonality chart are as follows:
- September is the worst month for XLF, averaging zero higher closes over the last five years with a return of -4%.
- October, November, and December make up XLF's strongest quarter with a higher-close rate of 50% and 75% and an average return of 4%, 7.2%, and 2.4%, respectively.
That's the seasonality profile over the last five years, and the recent economic environment weighs in heavily on the data. But what happens if you zoom out to 10 years, which includes economic activity before the pandemic and inflationary pressures that shaped the last five years?
10-Year Seasonality Chart of XLF

CHART 2. 10-YEAR SEASONALITY PROFILE FOR XLF. September's still a doozy.Chart source: StockCharts.com. For educational purposes.
Accounting for the sector activity before the economic challenges that came about during and after the pandemic, you can see that September is still an awful (though not the worst) month for XLF, raking in an average return of -1.6% with a higher-close rate of only 22%.
Like the five-year profile, October through December still comprises the strongest quarter, with November standing out as the strongest month with an 89% higher close rate and an average return of 6.2%.
Looking at these seasonality profiles, should you anticipate September's weakness as a potential bullish setup for a strong fourth quarter?
Financials—A Sector Breadth Perspective
It helps to analyze the financial sector in terms of breadth and assess how many financial stocks within the ETF are participating in the uptrend versus those that aren't. Below is a chart of the S&P Financial Sector Bullish Percent Index ($BPFINA) and XLF.
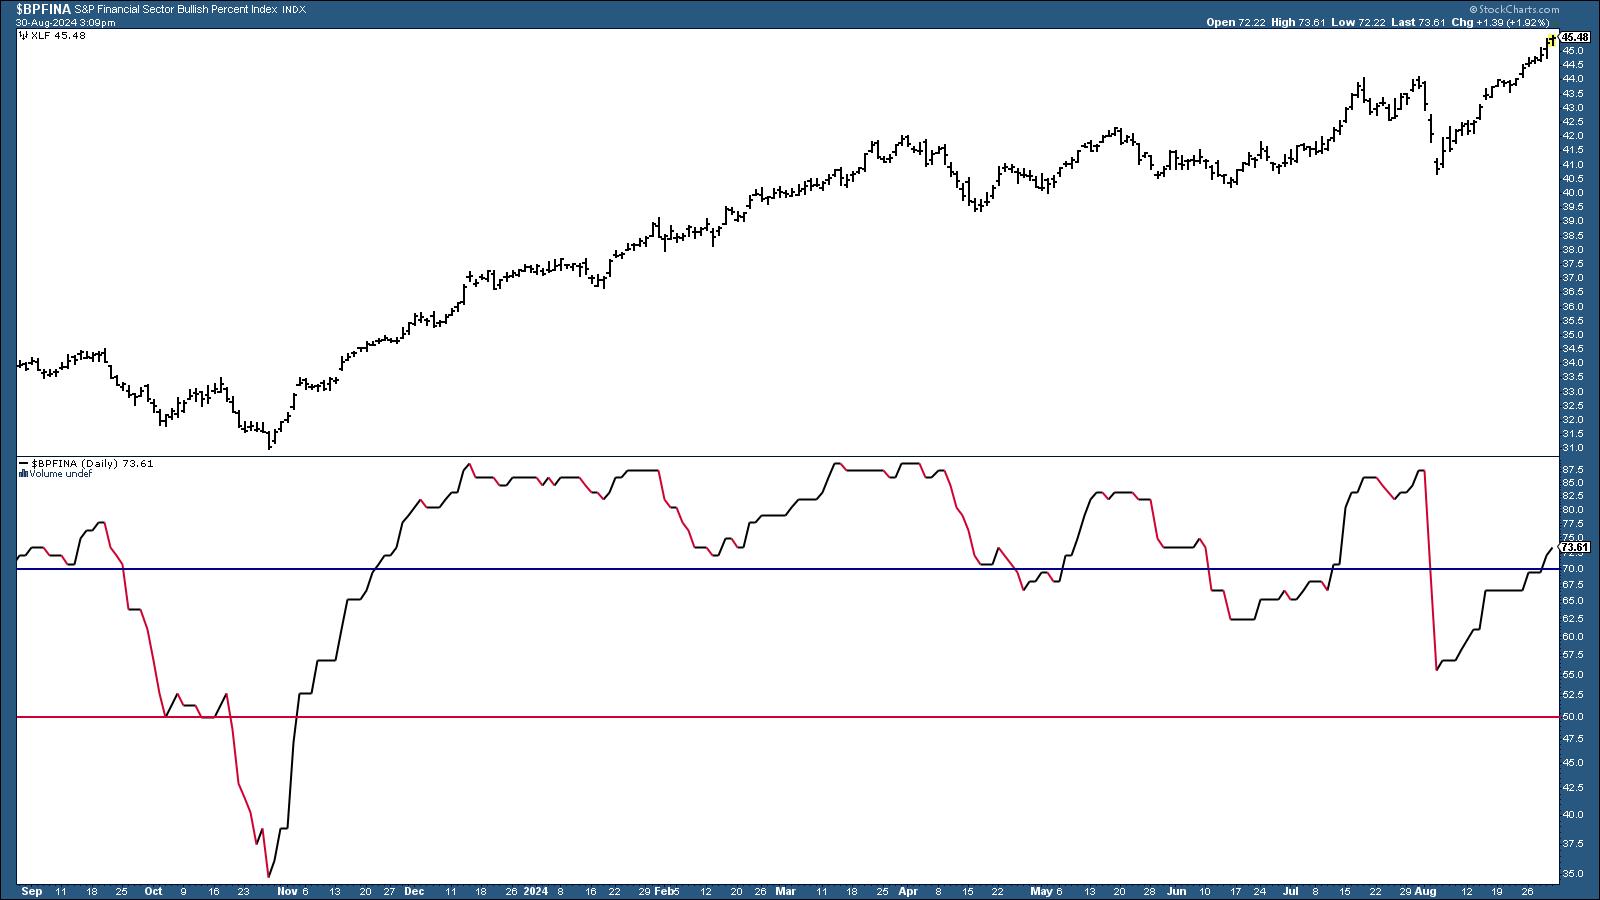
CHART 3. S&P FINANCIAL SECTOR BULLISH PERCENT INDEX. This indicator is entering oversold territory but can remain above 70 for an extended period if XLF continues trending higher.Chart source: StockCharts.com. For educational purposes.
 StockCharts Tip!
To recreate the chart, click on the above chart or follow these steps.
- Enter the symbol, in this case $BPFINA, in the symbol box.
- Select your preferred chart settings, such as chart style, time frame, log scale, etc.
- Enter horizontal line overlays using different parameters, i.e., 70, 50, and 30.
- Under Indicators, select Price from the dropdown menu, enter XLF in the parameters box, and position it above, below, or behind the BPI.
As XLF continues to trend higher (see price chart above the BPI chart), the financial sector as a whole is also entering overbought territory, according to the Bullish Percent Index (BPI).
Generally, a BPI line above 50% favors the bulls, while below 50% favors the bears. However...
- A rise from below 30% (oversold) indicates potential bullishness.
- A decline from above 70% (overbought) suggests bearishness.
If the seasonality trend plays out, what might you anticipate in the weeks ahead? Let's shift to the daily chart of XLF.
A Closer Look at XLF's Daily Price Action
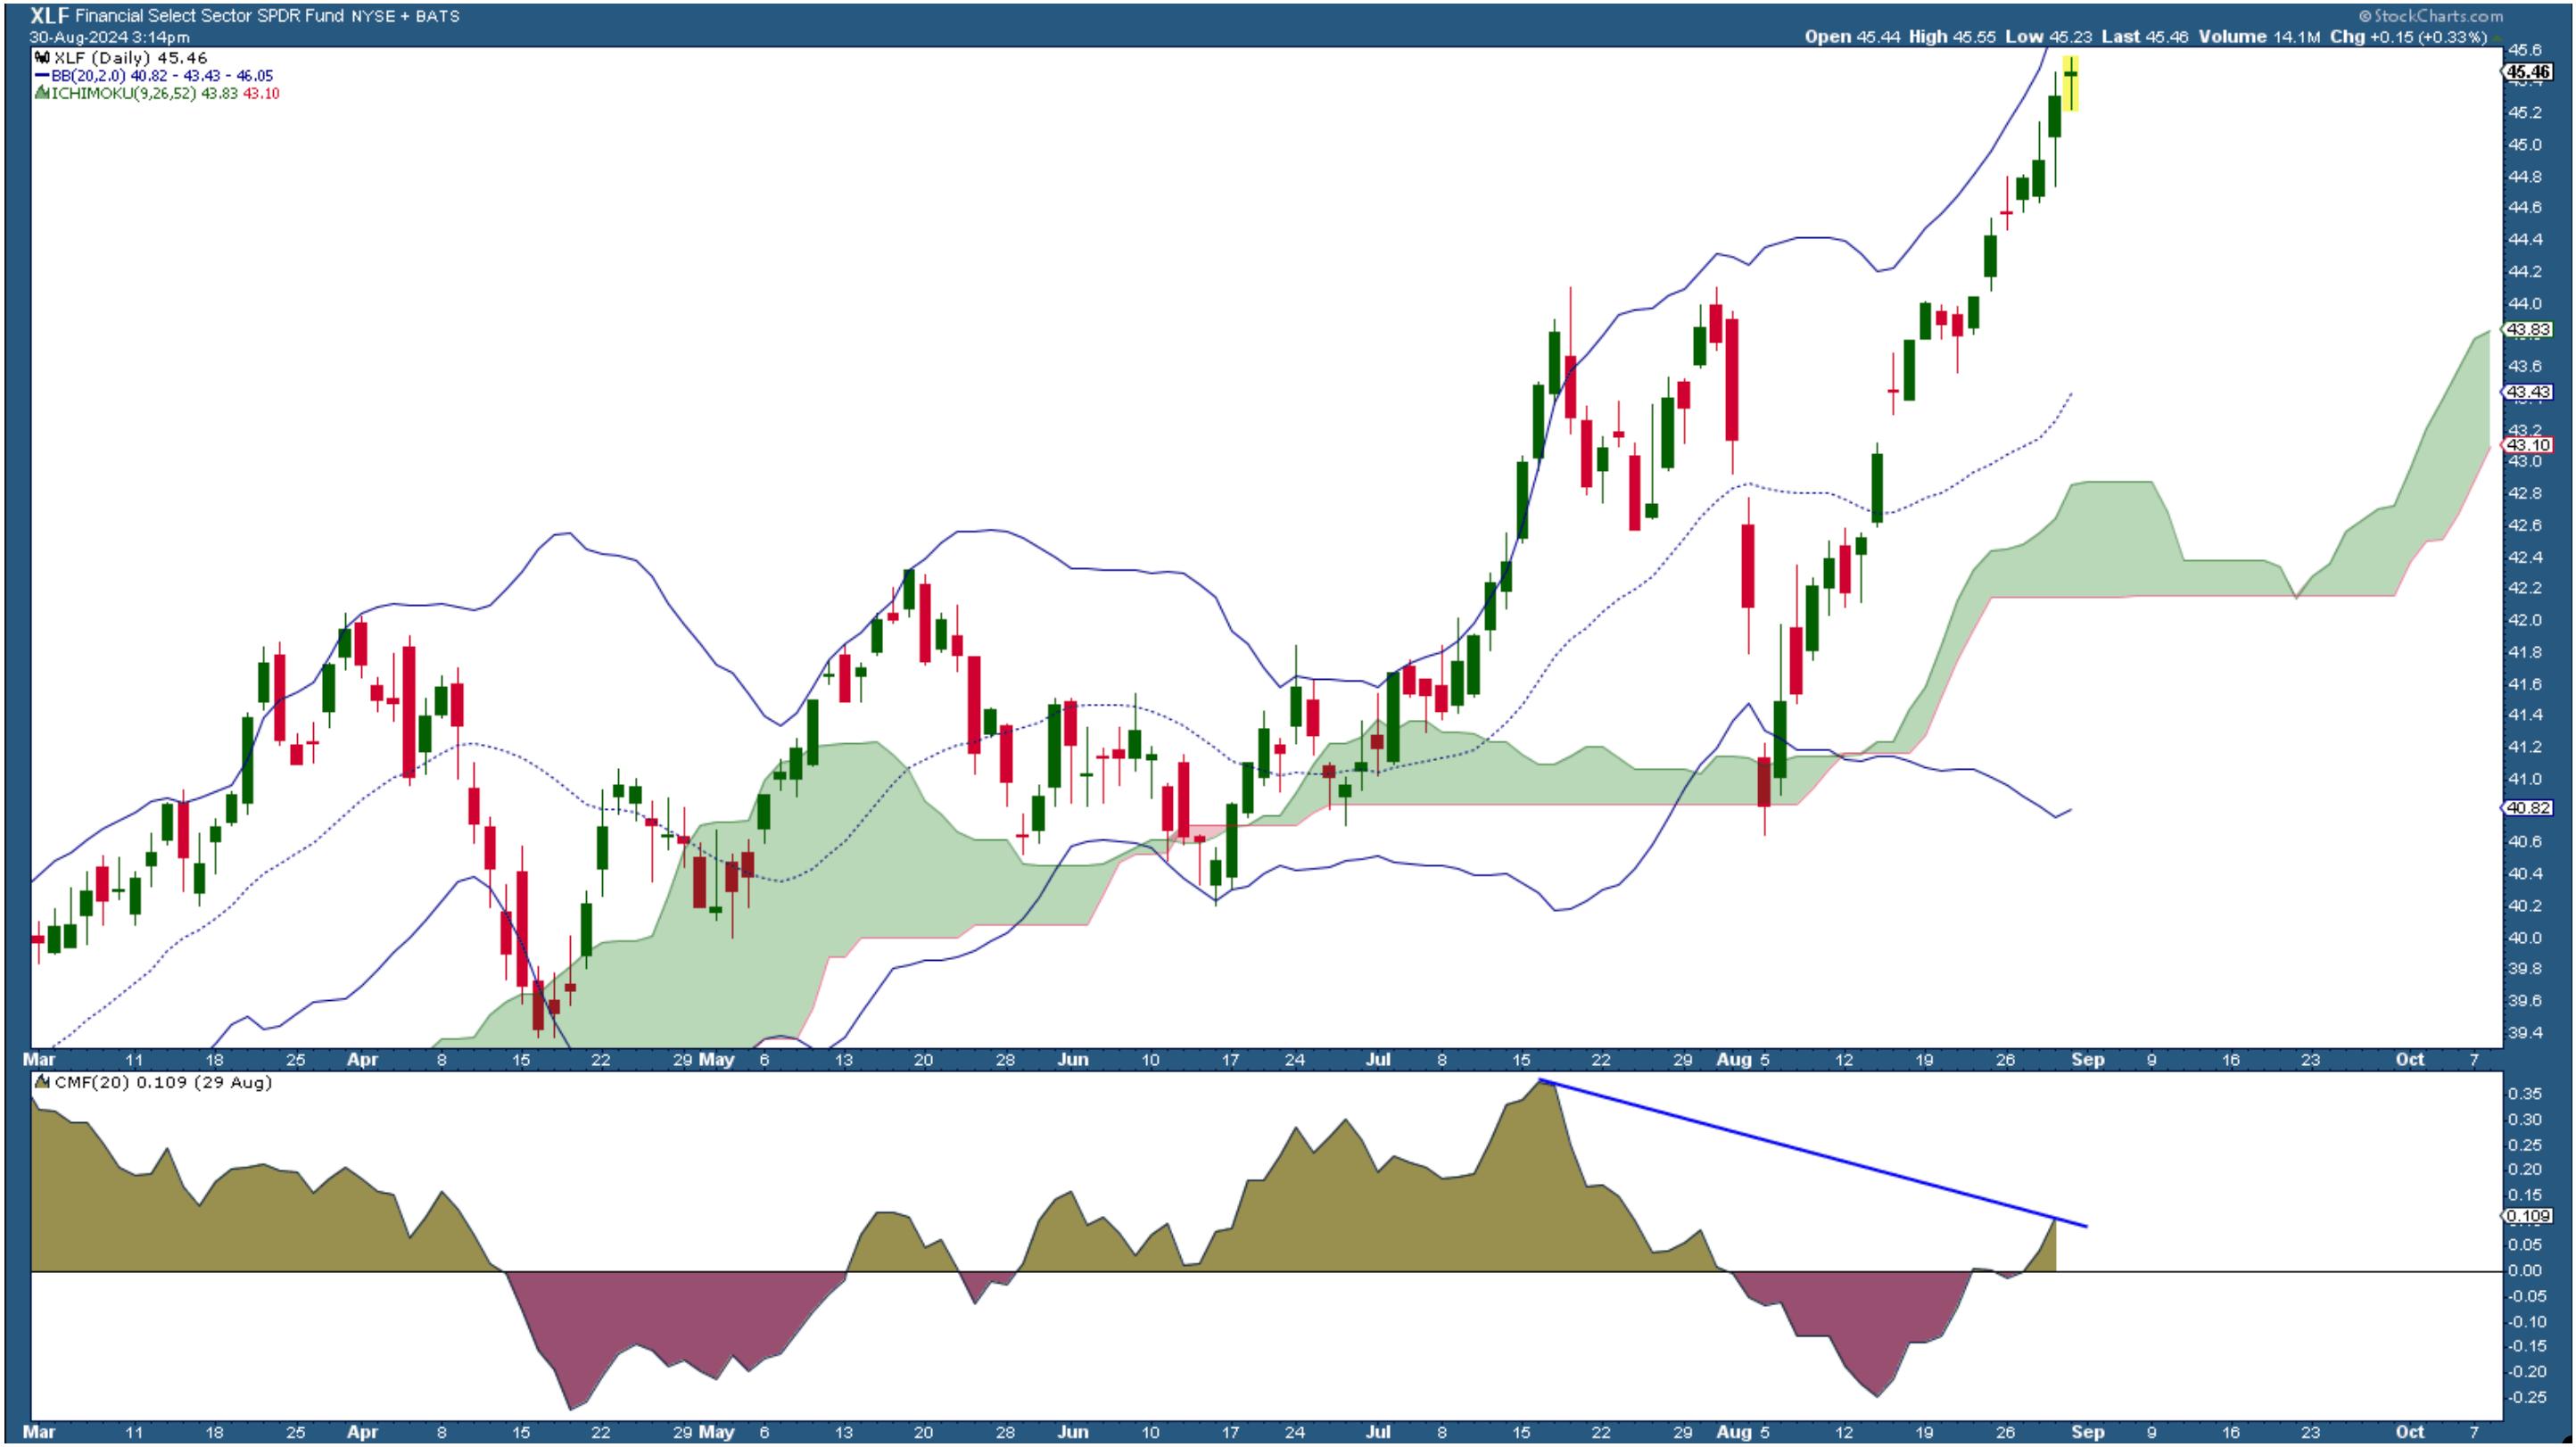
CHART 4. DAILY CHART OF XLF. No signs of stopping, yet note the divergence in CMF momentum.Chart source: StockCharts.com. For educational purposes.
In a nutshell:
- XLF shows no sign of slowing, yet the near-term surge is going parabolic.
- The Chaikin Money Flow (CMF) shows that buying pressure is picking up, but note the divergence between it and the price trend, suggesting that momentum may or may not be sufficient to fuel a continued rise.
- Price is hugging and nearing the top of the Bollinger Bands; price tends to revert back toward the middle, which, coincidentally, will likely meet the "kumo" level of the Ichimoku Cloud indicator.
In short, it's a wait-and-see moment. XLF's entry into overbought territory, coupled with declining momentum, aligns with the seasonal tendency for September's weakness. If a dip occurs and the fundamentals remain stable, a pullback toward the middle Bollinger Band or the "cloud" could present a strong buying opportunity.
Closing Bell
XLF is riding high (like, very high), but with September's seasonal weakness and its low-momentum entry into overbought territory, it's important to remain cautious. Keep an eye on how financial stocks perform in the coming weeks. If the anticipated dip happens and fundamentals stay solid, this could be your chance to buy in before the expected Q4 strength kicks in.
Be sure to save XLF in one of your StockCharts ChartLists.
Disclaimer: This blog is for educational purposes only and should not be construed as financial advice. The ideas and strategies should never be used without first assessing your own personal and financial situation, or without consulting a financial professional.
Happy charting!
