TAKEAWAYS
- Carvana stock takes the lead in the large-cap stocks SCTR Report
- CVNA stock has established an upside trend with higher lows and higher highs
- Carvana's stock price is holding above its 21-day exponential moving average

On a day when the S&P 500 ($SPX) drops over 200 points at the open, and the Dow Jones Industrial Average ($INDU) and Nasdaq Composite ($COMPQ) drop more than 1,000 points, looking at your portfolio value can be discouraging.
But it shouldn't be. On days like this, there's more reason to get proactive about stabilizing your financial portfolio. There are always opportunities in the stock market. The StockCharts Technical Rank (SCTR) is a helpful tool for identifying strong stocks with the potential to generate high returns.
Today's SCTR gold medal position in the Large Cap category is held by Carvana Co. (CVNA).
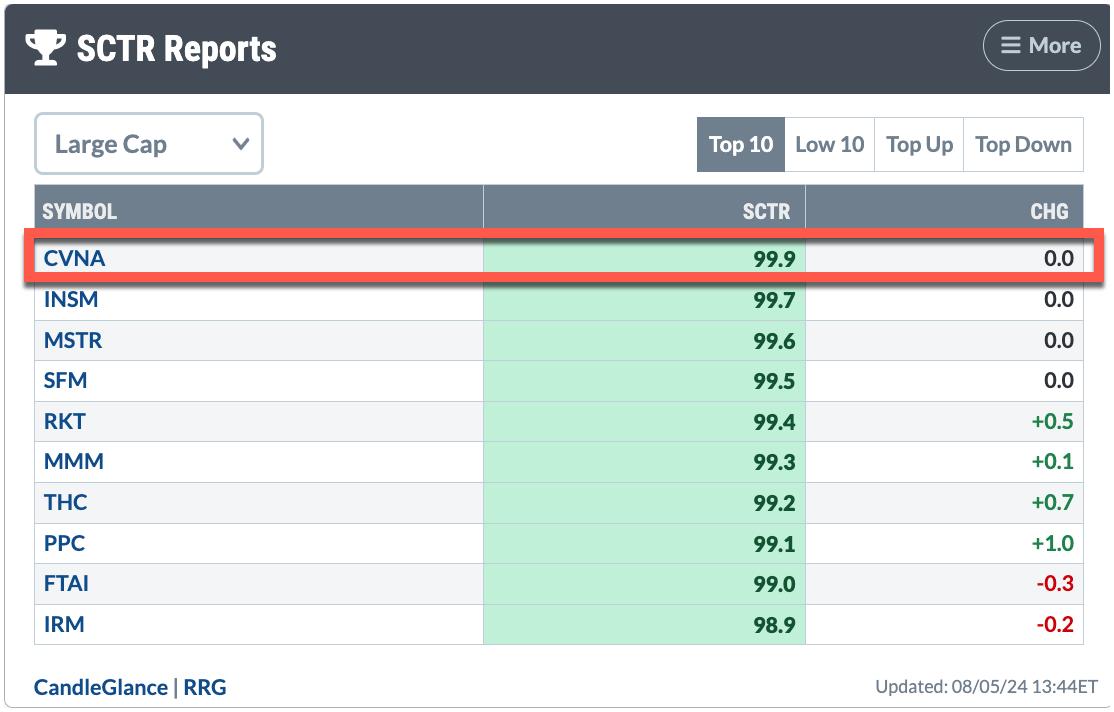
CARVANA STOCK RANKS #1 IN THE LARGE CAP CATEGORY.
Carvana Stock Ready To Ride
Let's do a deep dive into Carvana's technicals, starting with the weekly chart.
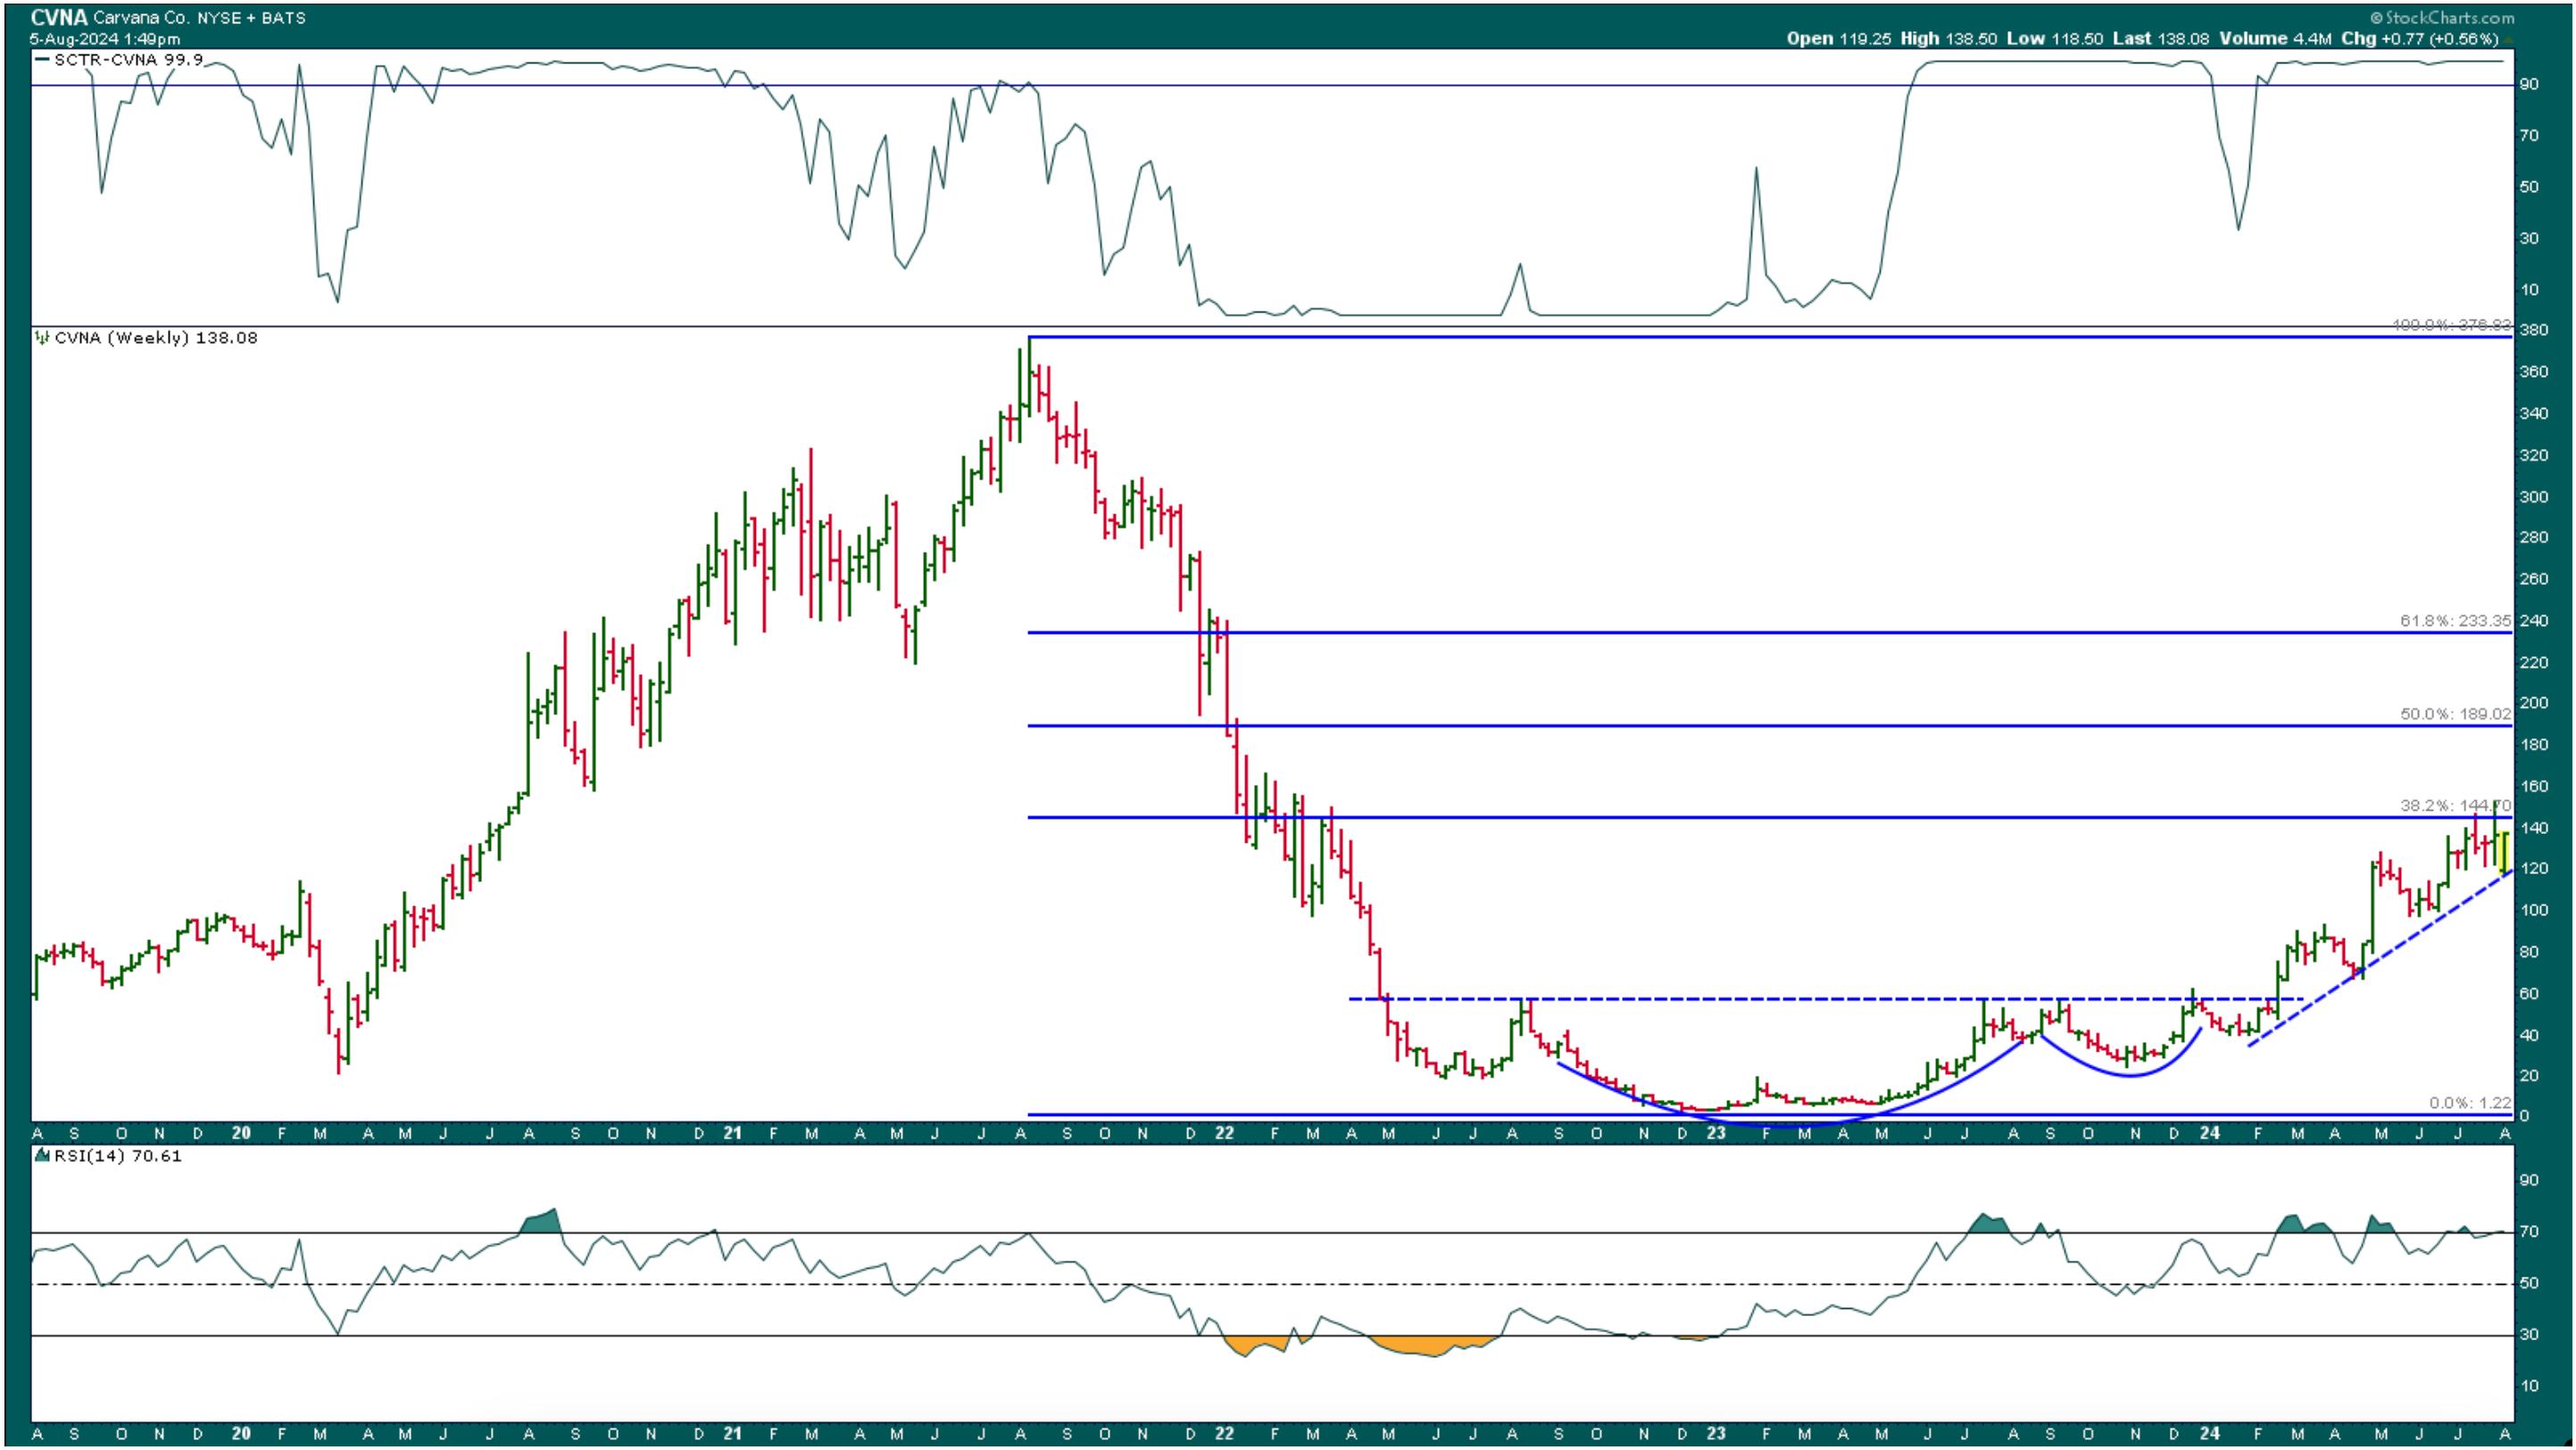
CHART 1. WEEKLY CHART OF CARVANA STOCK. The stock has started trending higher and could be a buying opportunity. Chart source: StockCharts.com. For educational purposes.
Going back five years, you can see that CVNA has had its glory days until August 2021, when its decline started. The stock price dropped from a high of $376.83 to a low of $3.55. After hibernating at its lows for over two years, the stock started showing signs of waking up.
- The stock price broke out of a cup-with-handle pattern in February 2024 and has been trending higher since then, with a series of higher lows and higher highs (see blue dashed trendline).
- The SCTR score started rising as early as April 2023, crossing above 90 in May of that same year. The SCTR declined briefly from January to February 2024 and has retained its position above 90 since then. This action in the SCTR should have prompted investors to keep CVNA on their radar as a potential investment.
- The pullback in April 2024 and bounce off the upward-sloping trendline would have been an ideal time to enter the stock. At that time, the relative strength index (RSI) was crossing above the 70 level.
- CVNA has pulled back to its trendline and bounced off it. This upside bounce would present an opportunity to go long the stock. Note that price is close to its 38.2% Fibonacci retracement from the August 2021 high to the December 2022 low.
When's a Good Time To Buy CVNA Stock?
With a SCTR score of 99.9, CVNA is a buy candidate, but it's best to look at other indicators to confirm an entry point. Let's switch to a daily chart of CVNA to identify entry and exit points.
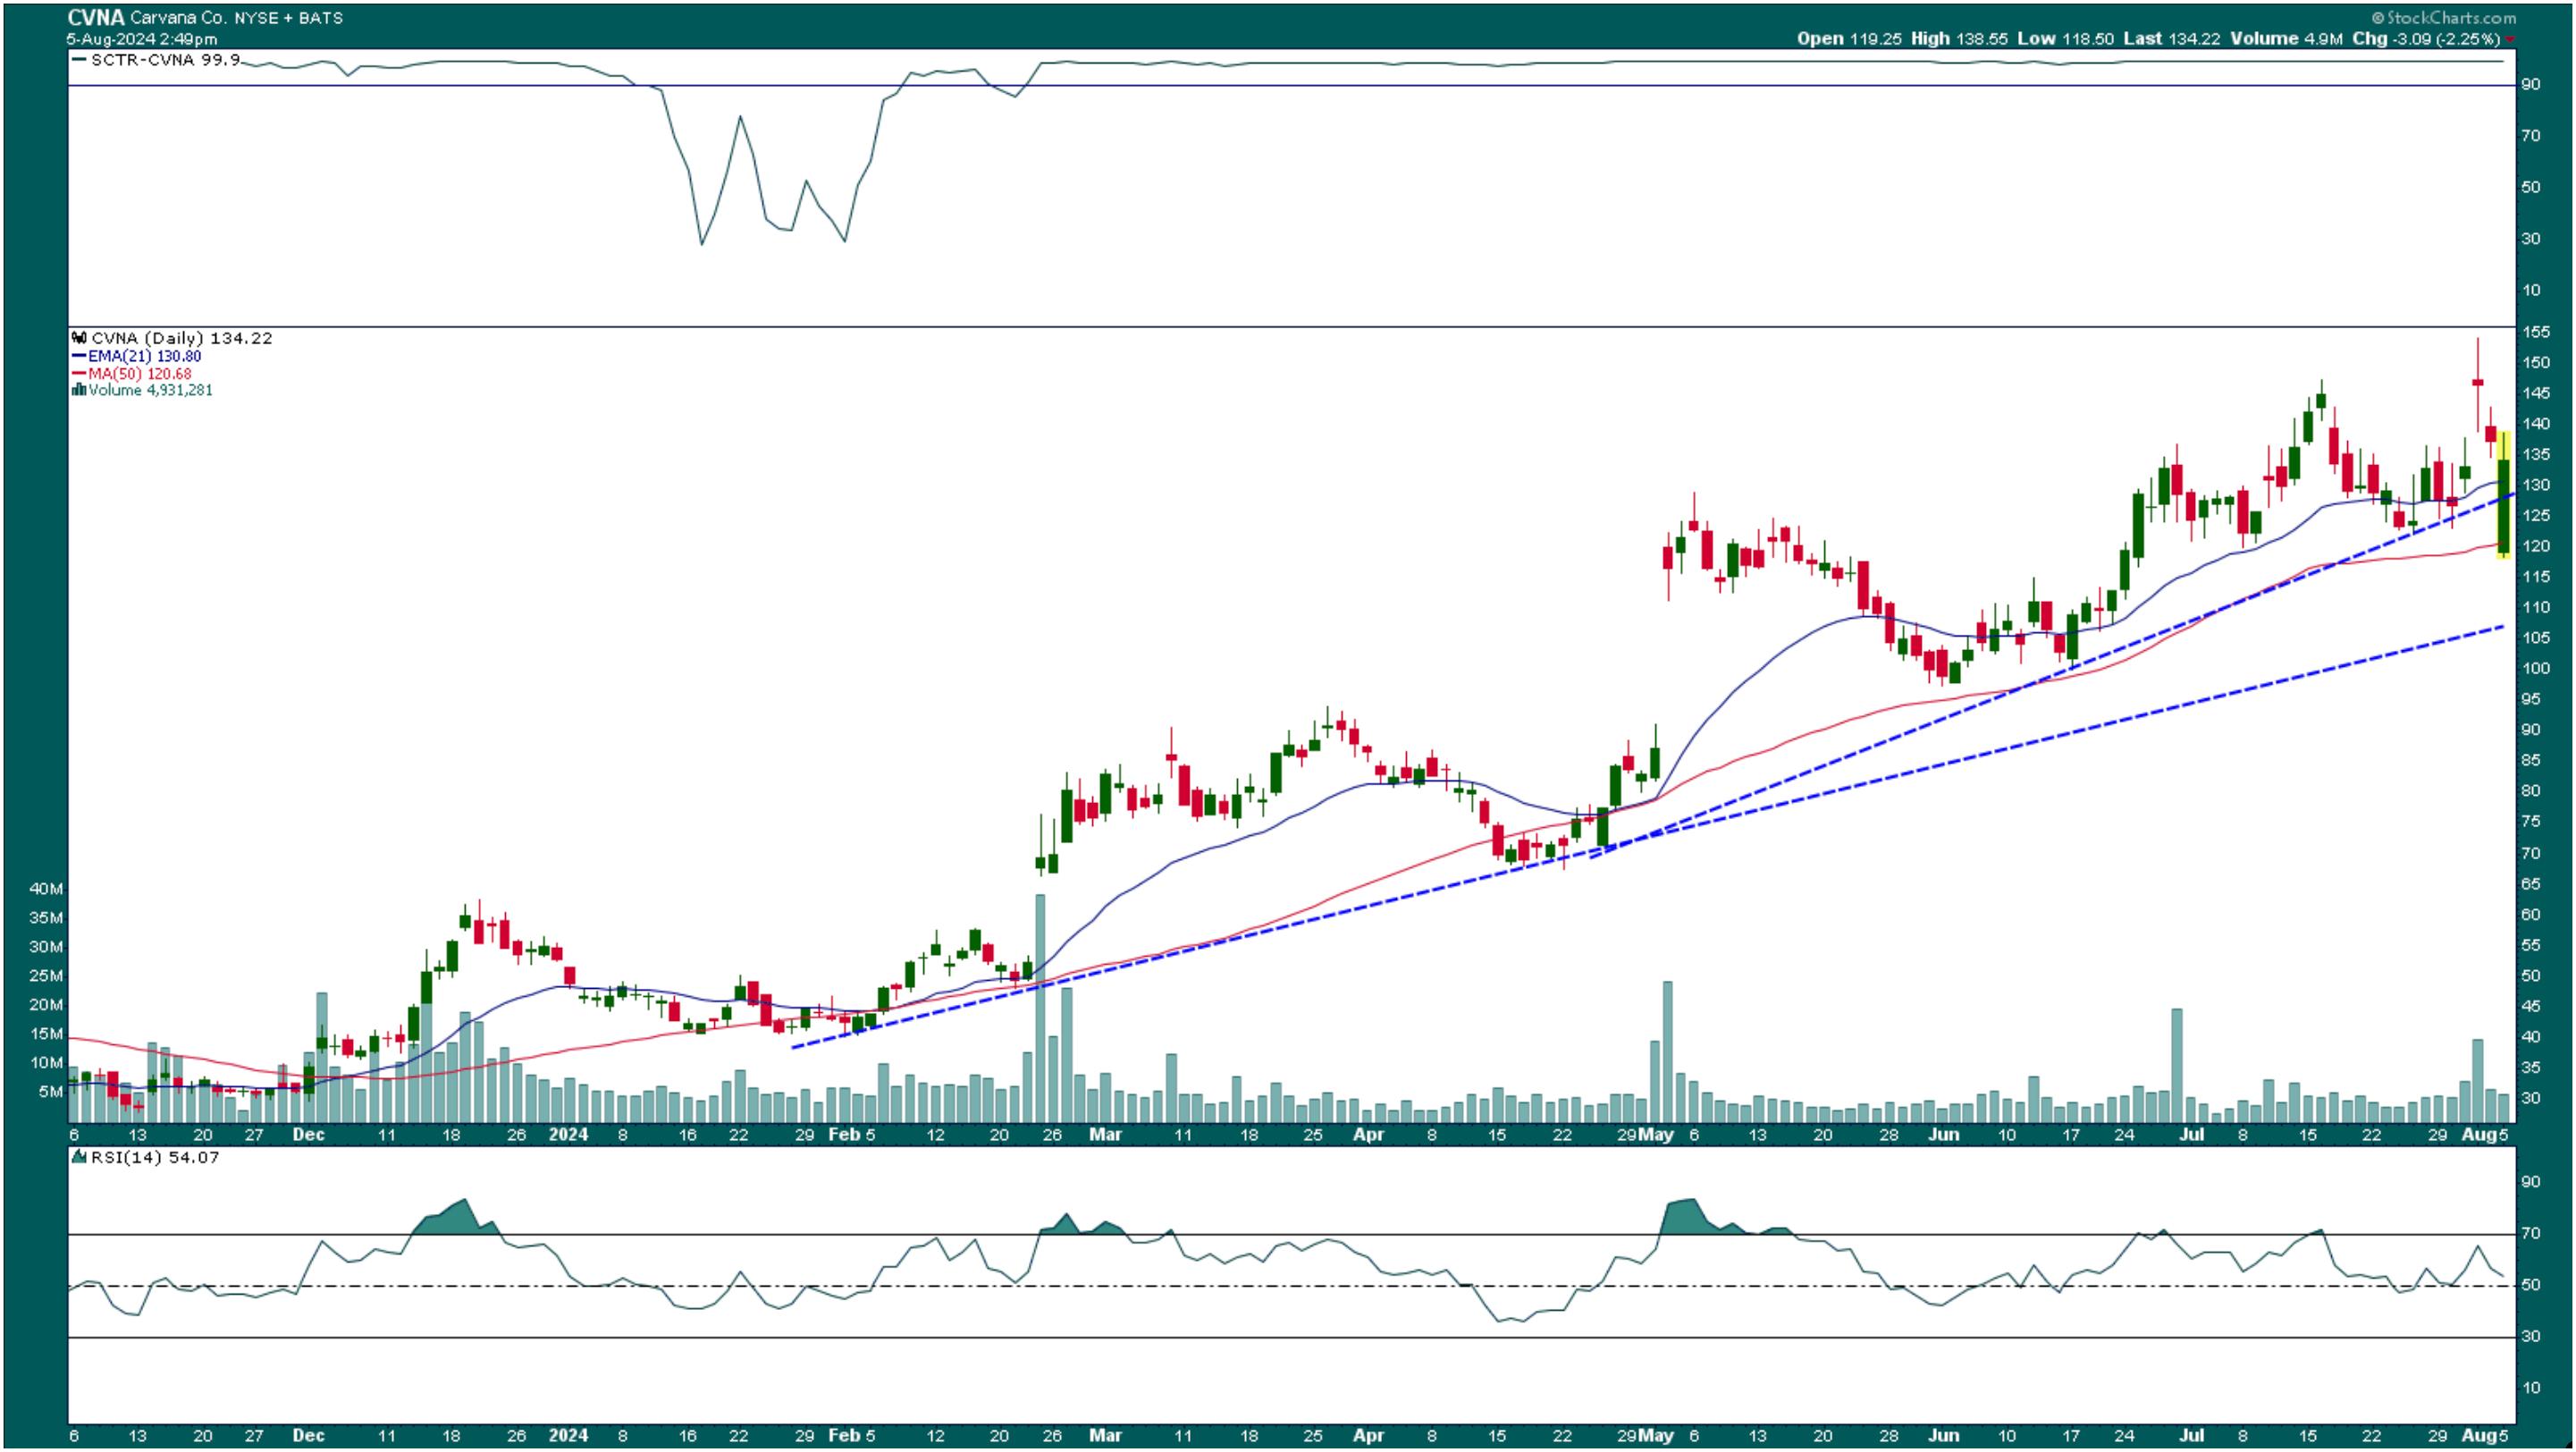
CHART 2. DAILY CHART OF CVNA STOCK PRICE. The daily chart shows an uptrend, but the RSI is moving lower. Chart source: StockCharts.com. For educational purposes.
The trend is still to the upside, short- and long-term. For a massive selloff day in the overall stock market, CVNA's price action is a spark of optimism. After hitting a low of $118.50, buyers came in, and the stock price traded above its shorter-term trendline and 21-day exponential moving average (EMA), which is sloping higher.
The RSI is above 50 and is trending lower. An encouraging sign would be to see it turn higher, even if slightly. Assuming all the other indicators mentioned above continue to support further upside in the stock, including above-average volume, I'd look for RSI to turn higher and price to move above $144.70, the 38.2% Fib retracement level from the weekly chart to enter a long position.
When Should You Exit CVNA Stock?

As a general rule, you should exit your trade any time your entry conditions are violated. If you open a long position, place a stop loss at a significant support level. For example, if you buy CVNA at $144.80, just above the 38.2 Feb level, place a stop loss just below the 21-day EMA. Depending on your risk tolerance level, you could apply a shorter-term EMA. If the stock continues to move higher, use the EMA as a trailing stop level.
Price targets can be set at the Fibonacci levels from the weekly chart. The first would be $189.02, and the next would be $233.35.
CVNA has the potential for a high return with relatively low risk. This one is worth watching very closely. A buying opportunity could be just around the corner.
Thanks, SCTR!
Disclaimer: This blog is for educational purposes only and should not be construed as financial advice. The ideas and strategies should never be used without first assessing your own personal and financial situation, or without consulting a financial professional.
Happy charting!


