TAKEAWAYS
- The stock market indexes end the week on a positive note after a scary Monday
- Volatility steps back slightly after a brief spike over 65
- Next week's consumer and producer inflation data could help set direction

A sigh of relief? The US stock market started the week on a pessimistic note, but changed course toward the end of the week, ending in a more positive tone.
Last week's weaker-than-expected jobs report scared investors into thinking that perhaps the Federal Reserve was too late in cutting interest rates. However, last week's ISM Services report and Thursday's jobless claims eased those concerns.
Stock Market Indexes Are Better, Technically
While the charts of the S&P 500 ($SPX), Dow Jones Industrial Average ($INDU), and the Nasdaq Composite ($COMPQ) are showing signs of strength, it's too early to declare that it's beginning to rally to the upside. Let's analyze the charts of all three indexes in more detail and see where they stand.
The Mega-Cap S&P 500 Index
The S&P 500 held the support of its 100-day simple moving average (SMA) and its 50% Fibonacci retracement (from the April low to July high). While the S&P 500 looks like it's trying to move higher (see chart below), the next resistance level isn't too far off. The 38.2% Fib retracement at 5400 was a support level for some previous lows. If the S&P 500 reaches that level, the August 2 gap will be filled.
Until the index breaks above the 5400 level, you can't call this week's price action a bullish rally. All the more reason to watch the price action in the S&P 500.
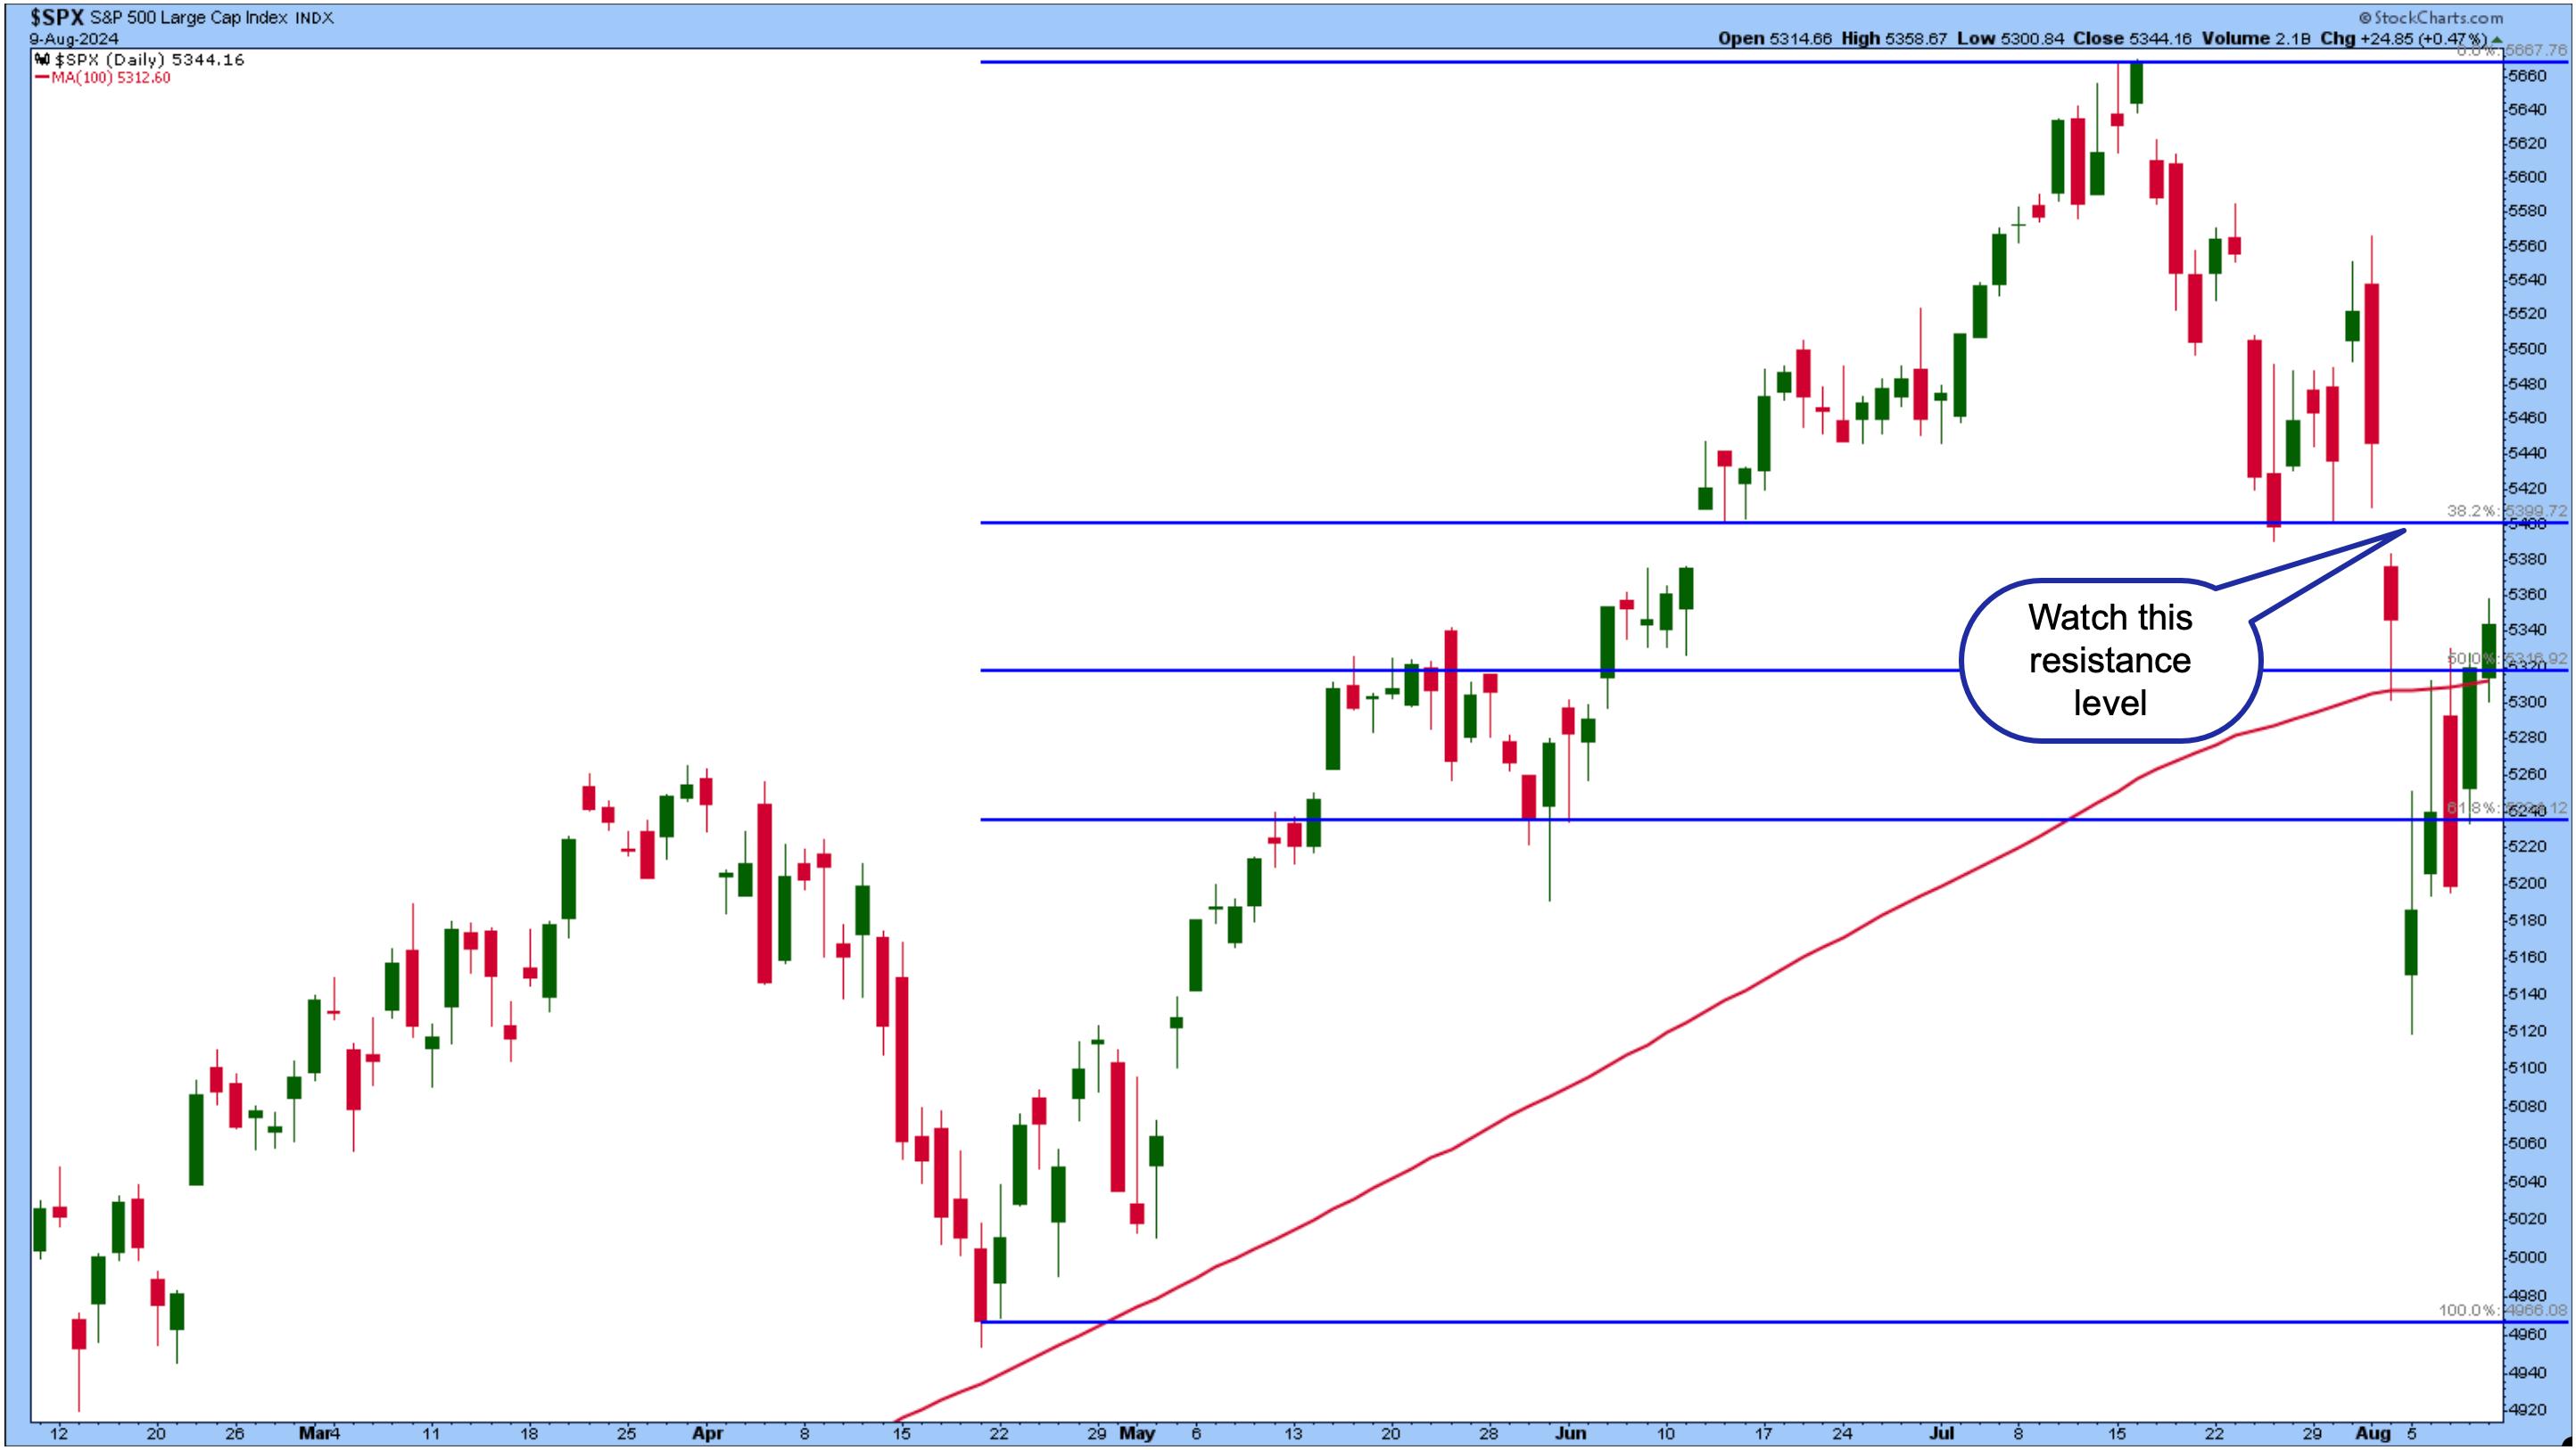
CHART 1. DAILY CHART OF THE S&P 500. The index ended the week closing above its 100-day moving average and its 50% Fibonacci retracement level, but it's too early to call this a bullish move.Chart source: StockCharts.com. For educational purposes.
Tech-Heavy Nasdaq Composite
The Nasdaq Composite is also improving, but hasn't reached the ranks of the S&P 500. From a technical standpoint, the Nasdaq Composite is approaching its 100-day SMA and 50% Fibonacci retracement level (from April lows to July high), which could act as a resistance level (see chart below). Looking back, you can see that level was a resistance and support level in the past.
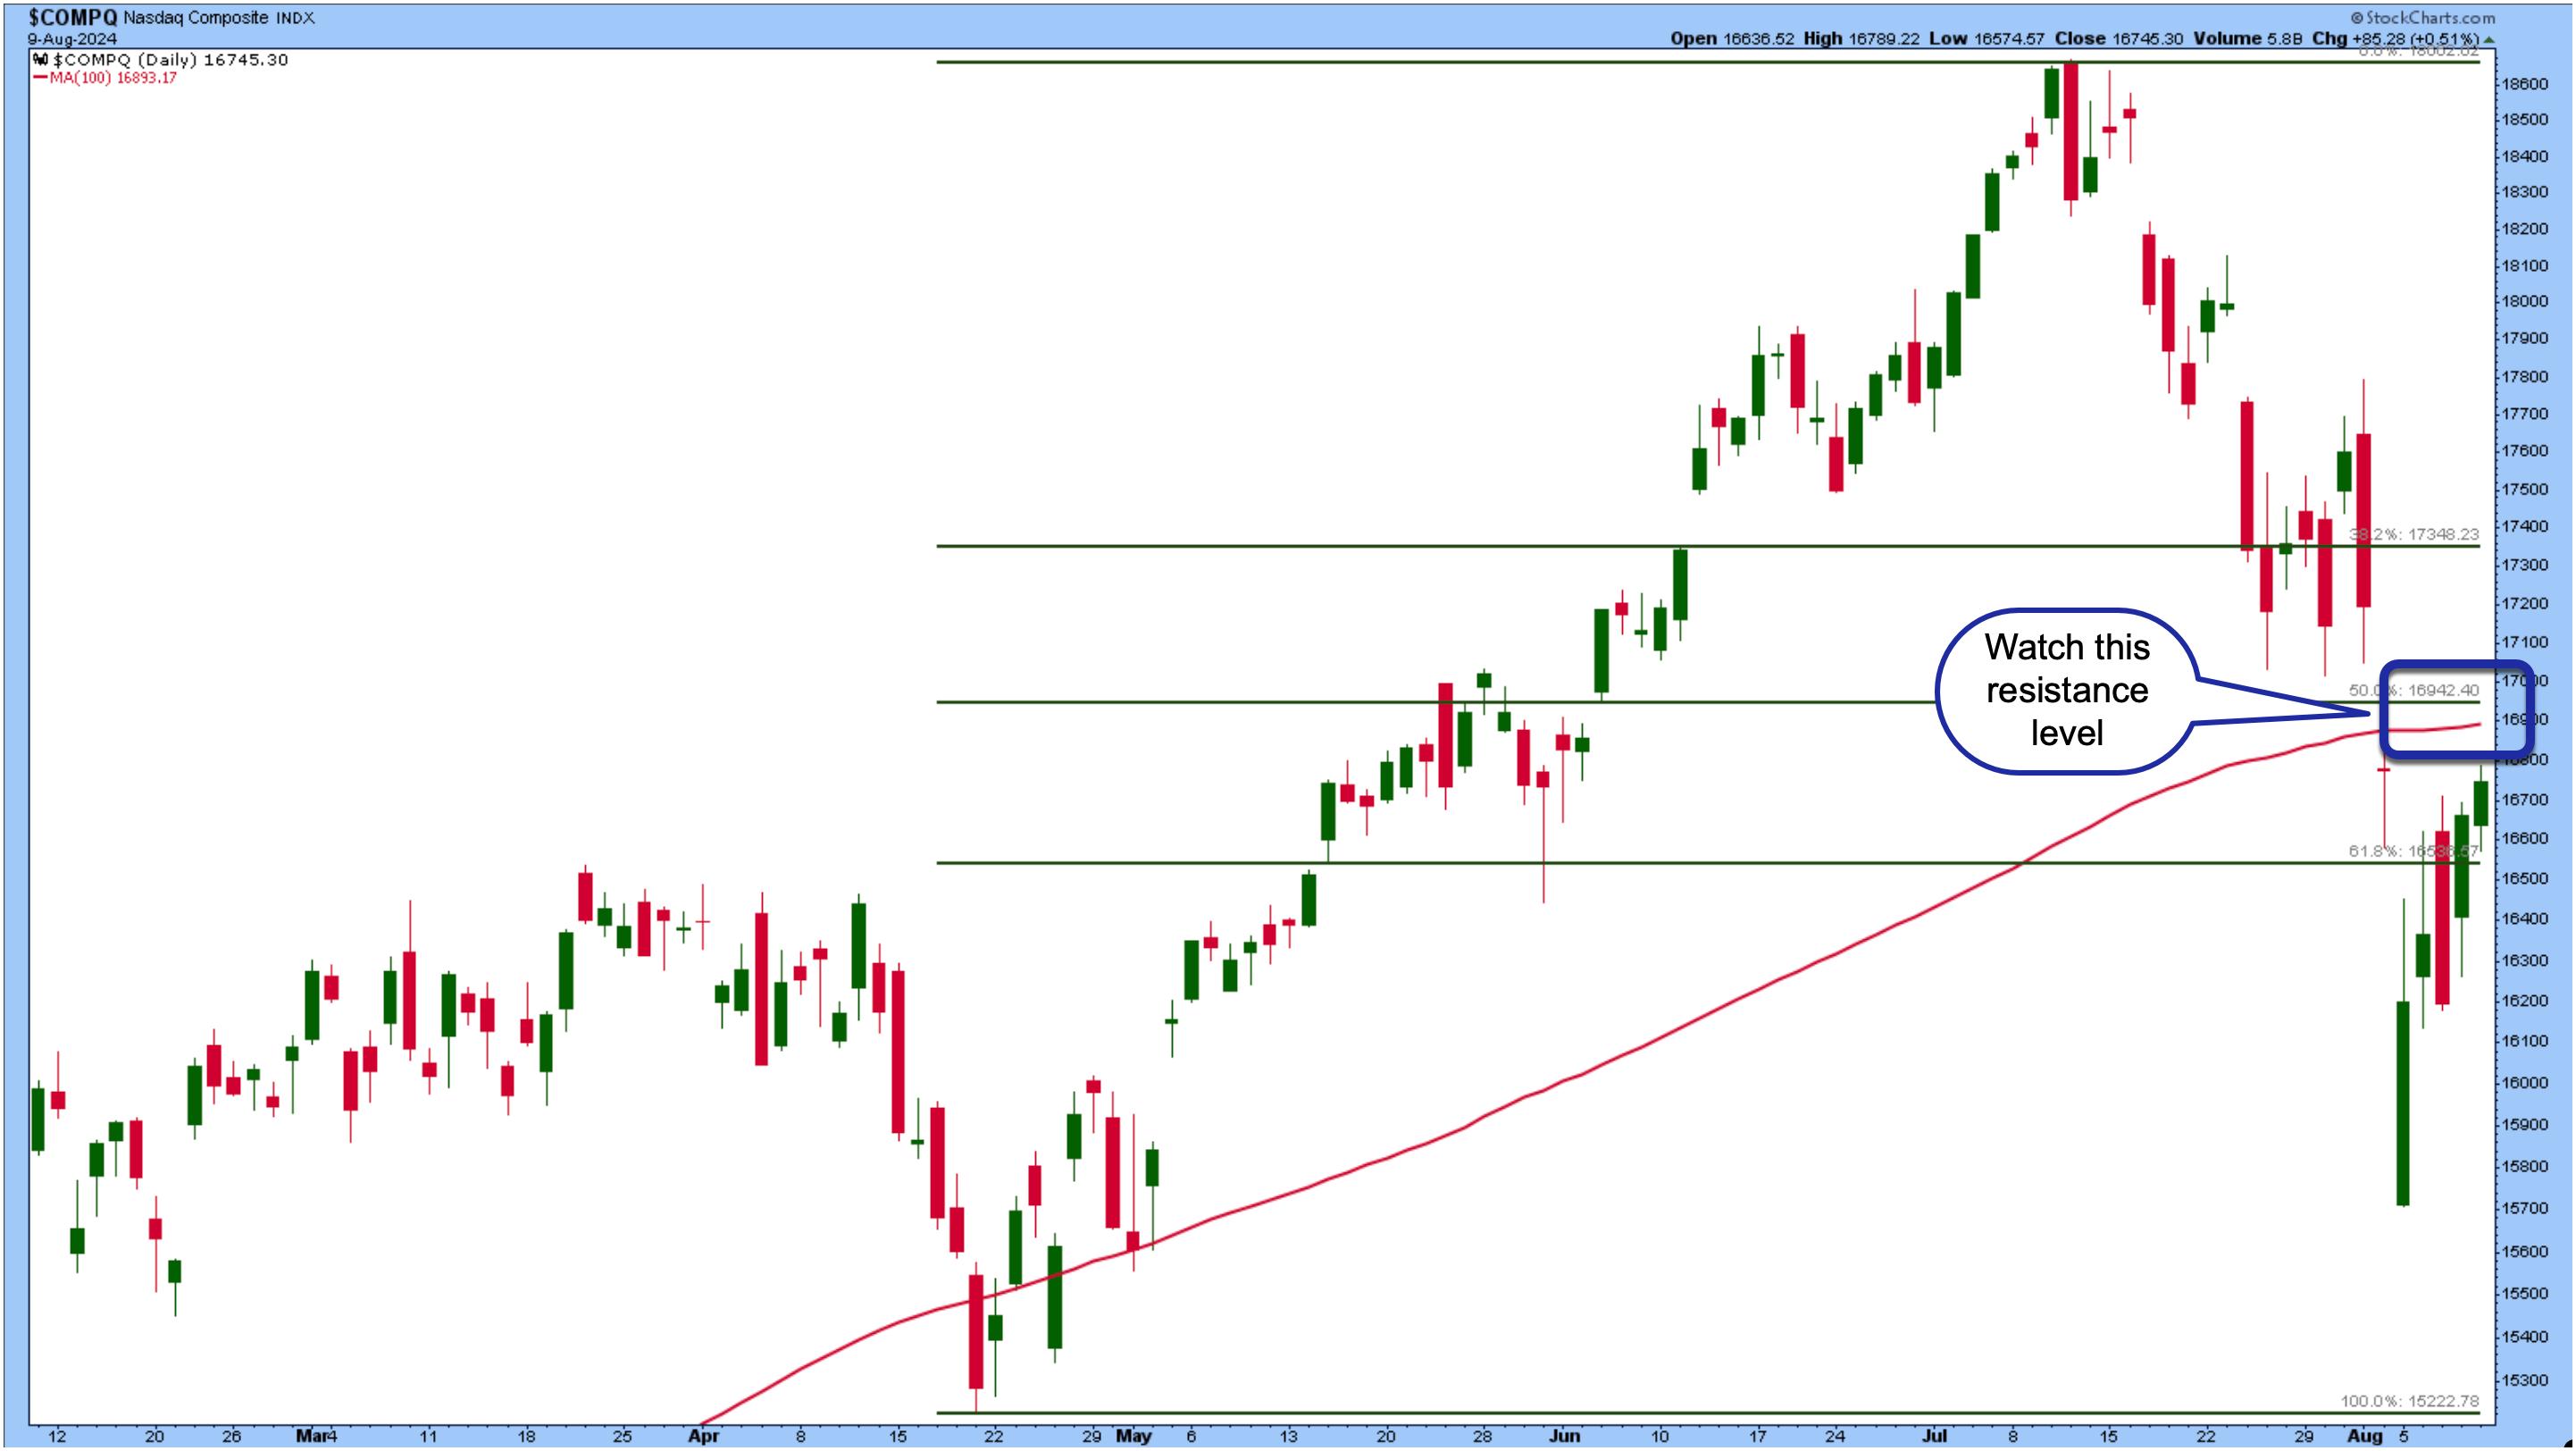
CHART 2. DAILY CHART OF NASDAQ COMPOSITE. Watch the resistance level that's close by. Will the index break through this level, or will it be a resistance level that it'll have a tough time pushing through?Chart source: StockCharts.com. For educational purposes.
The Dow Jones Industrial Average differs slightly from the S&P 500 and Nasdaq, but also looks better technically (see chart below). It peaked on July 18, declined a few days later, and tried to reach the previous peak.
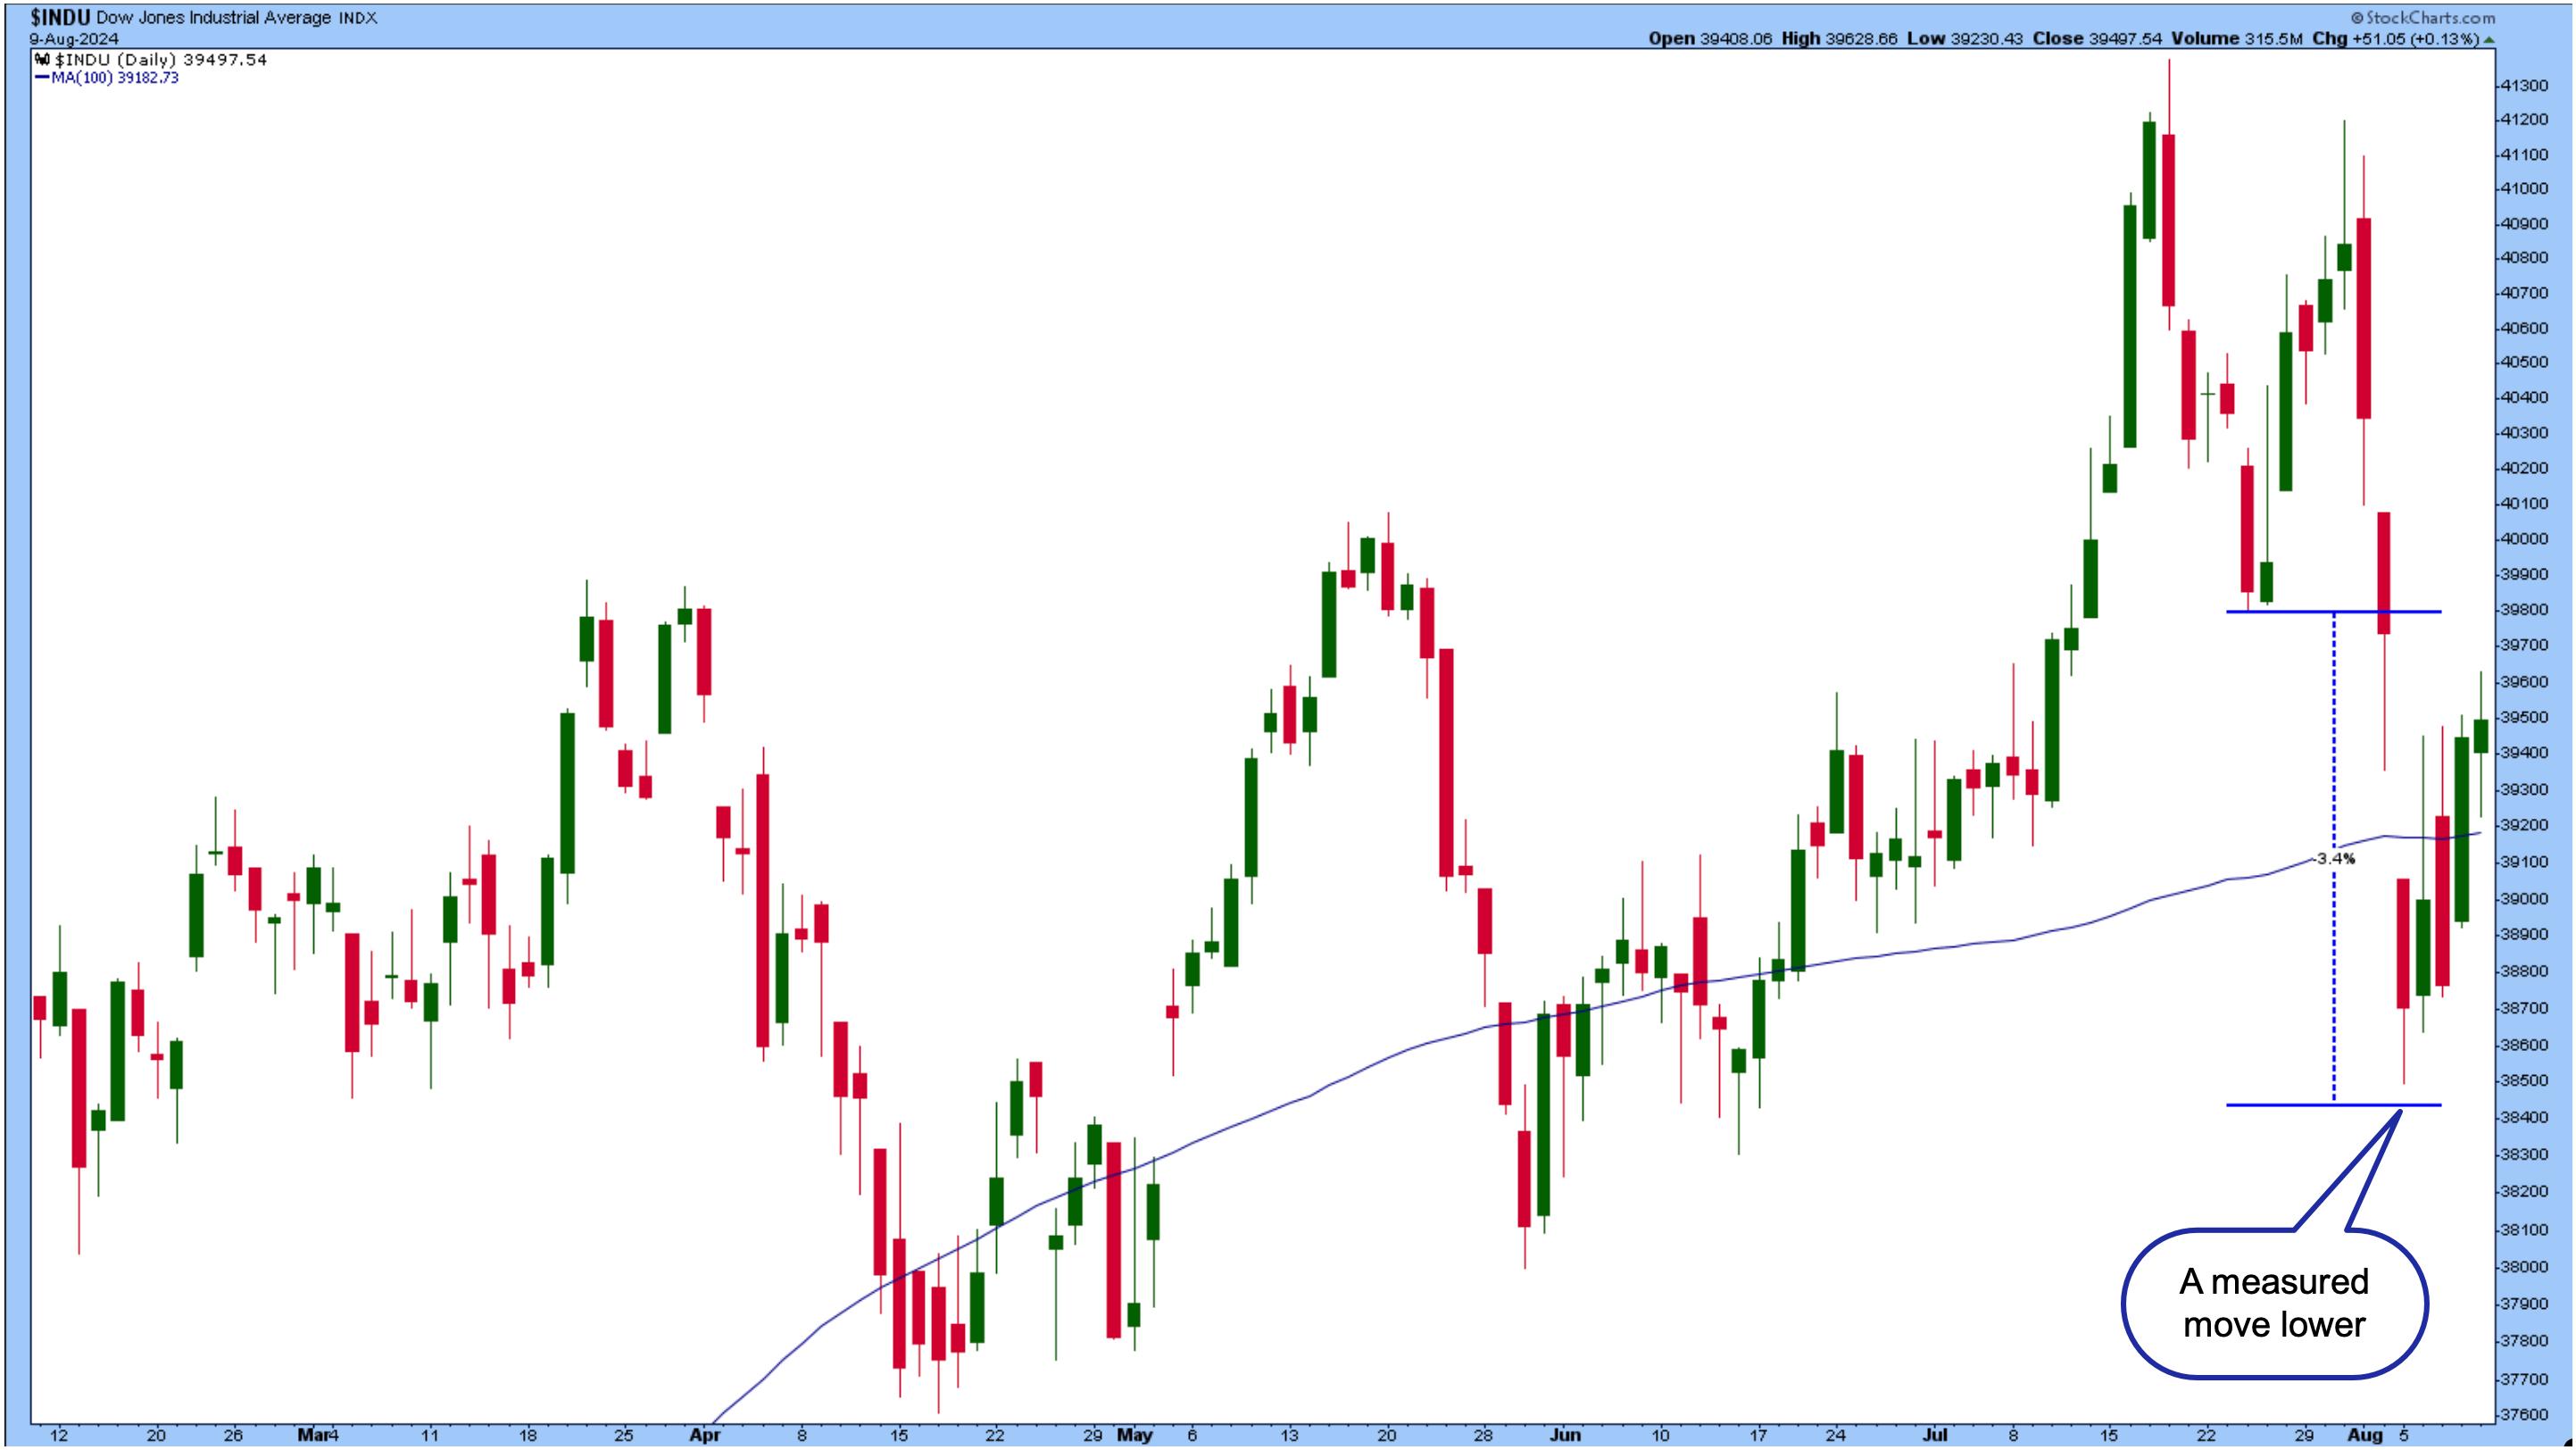
The price action is almost like a double top pattern. What's interesting is that the index almost reached its measured move lower. The measured move from the July 18 high to July 24 trough was 3.4%. From the chart below, you can see that a 3.4% decline from the July 24 low would bring the index to 38,438. The Dow went as low as 38,499 before moving higher.
Overall, it seems that equities are trying to recover. But will the recovery be sustained?
Recession worries may be in the rearview mirror for a while, but investors continue to walk a fine line. On Monday, the CBOE Volatility Index ($VIX) went as high as 65.73. The last time we saw those levels was in March 2020, when COVID was a concern.
Volatility has come down significantly, but is still above 20. It's too early to say the market is done with fear; we've only started to see a change. Remember, it was just a few days ago when the stock market saw an excessive selloff. Next week, there are important reports on consumer and producer inflation, retail sales, and consumer sentiment.
Inflation Data: What To Know
With rate cut expectations on the radar, you'll want to stay on top of next week's inflation data. The Federal Reserve Bank of Cleveland estimates a year-over-year percent change of 3.01% for headline CPI and 3.33% for Core CPI. If the data shows that inflation is coming down as it has been in the last few months, investors could sigh a huge relief. Conversely, if the data comes in hotter than expected, it could throw things off. But that's unlikely since a rate cut in September is very probable. That's not to say it's not possible, though.
Watch the price action in bonds ahead of the US inflation data. Bond prices showed signs of leaving the start line but have retreated. The daily chart of the iShares 20+ Year Treasury Bond ETF TLT below shows the ETF bounced off a support level.
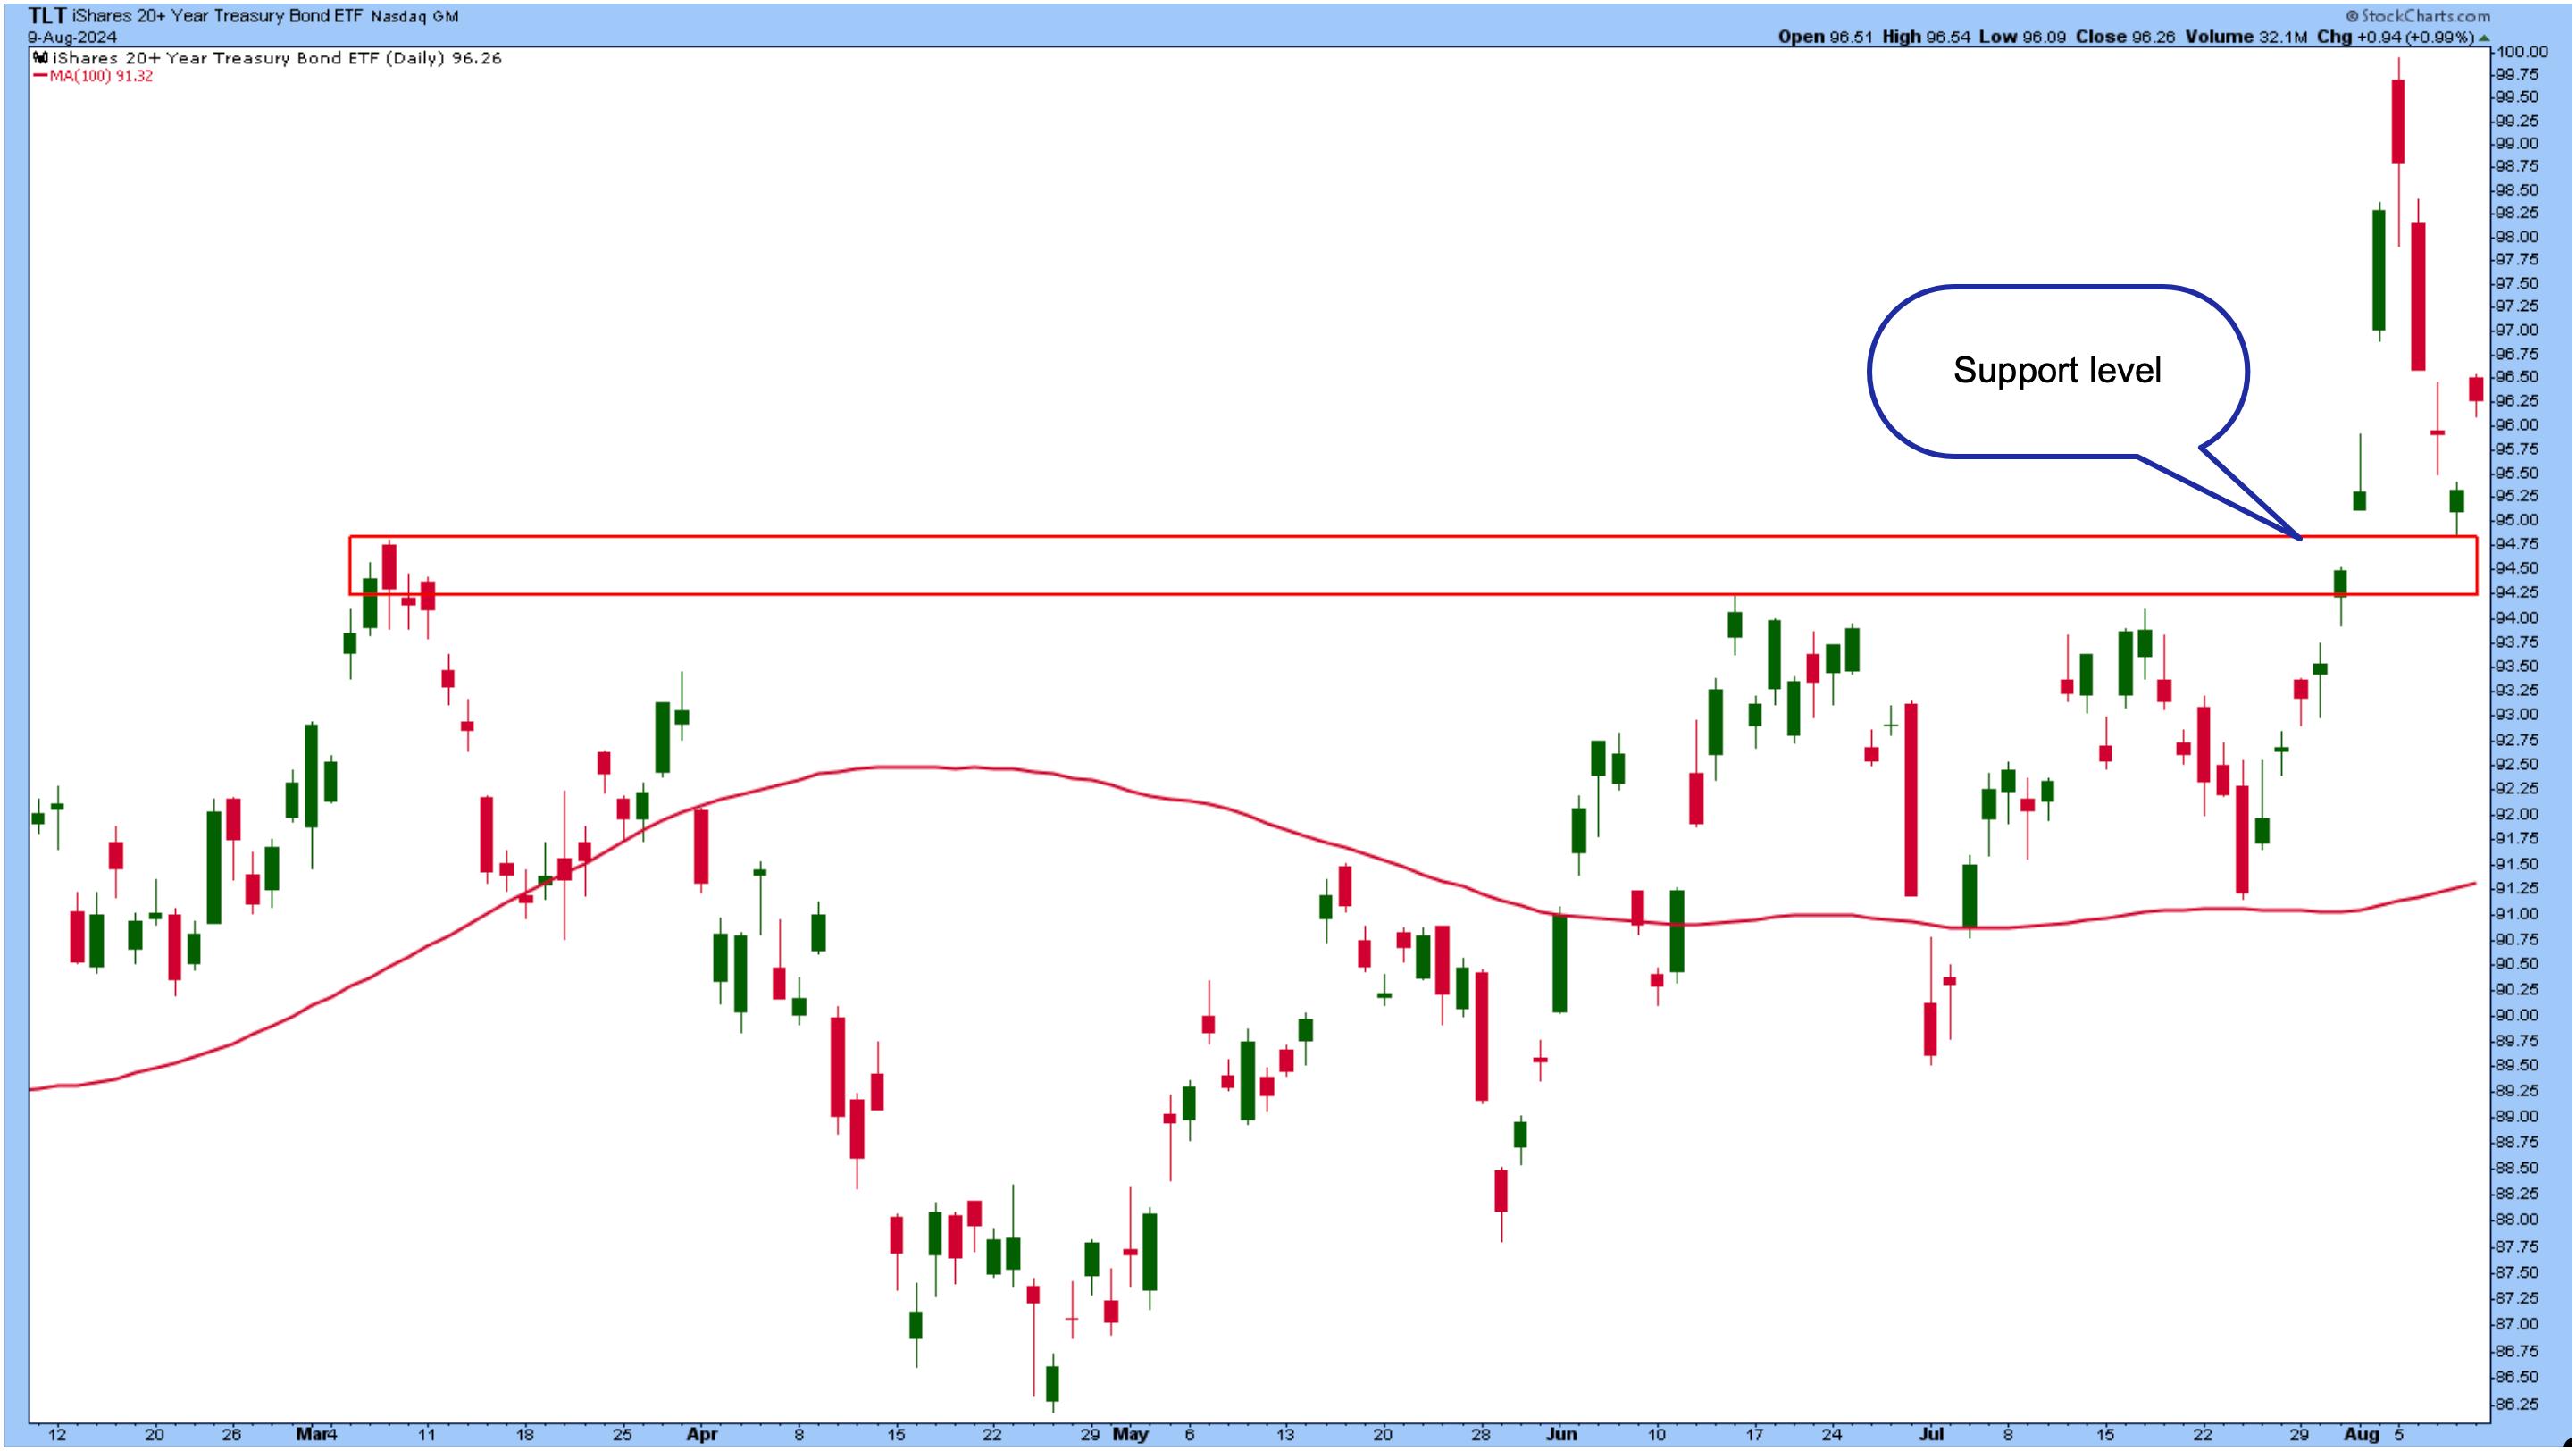
Which direction will TLT move? If the inflation data supports a September rate cut, then TLT will move higher, possibly before the report is released.
Another note is that the CME FedWatch Tool shows the probability of a 50 basis point rate cut in September at 49.5. That's a significant drop from the end of last week, when the probability was close to 90%.
Closing Position
Proceed with caution. We've seen how quickly the market can change direction. Any piece of negative data could send volatility through the roof again. The stock market is hanging on, and the best you can do is note the important support levels in the broader indexes, sectors, and individual equities. If equities can hang on next week, they'll be on more solid footing. Right now, you need to have a safety net close by.
End-of-Week Wrap-Up

- S&P 500 closed down 0.04% for the week, at 5344.16, Dow Jones Industrial Average down 0.60% for the week at 39,497.54; Nasdaq Composite closed down 0.18% for the week at 16745.30
- $VIX down 12.91% for the week closing at 20.37
- Best performing sector for the week: Industrials
- Worst performing sector for the week: Materials
- Top 5 Large Cap SCTR stocks: Insmed Inc. (INSM); Carvana Co. (CVNA); FTAI Aviation Ltd. (FTAI); Sprouts Farmers Market (SFM); SharkNinja, Inc. (SN)
On the Radar Next Week
- July Producer Price Index (PPI)
- July Consumer Price Index (CPI)
- July Retail Sales
- August Michigan Consumer Sentiment
- July Housing Starts
- Fed speeches from Bostic, Harker, Musalem, Goolsbee,
- Earnings from Walmart (WMT), Cisco Systems (CSC), Home Depot (HD), among others.
Disclaimer: This blog is for educational purposes only and should not be construed as financial advice. The ideas and strategies should never be used without first assessing your own personal and financial situation, or without consulting a financial professional.
Happy charting!


