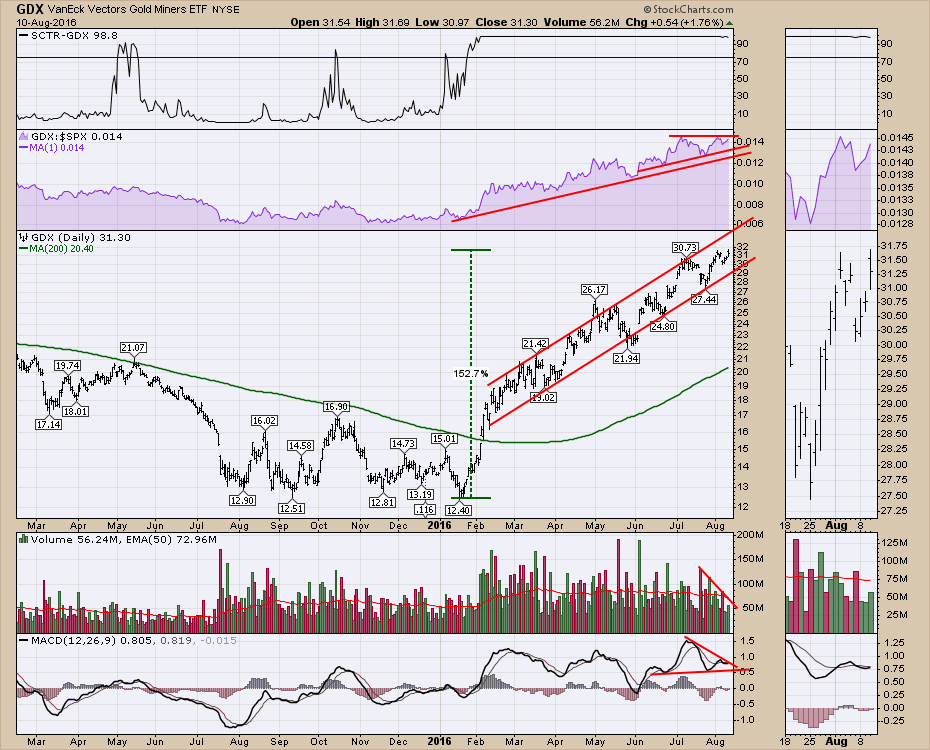
Investing in Gold miners (GDX) has been a big winner this year. So far 150% in a non-leveraged ETF. But it is always good to keep evaluating the trend. We can look at the pluses and minuses on the Gold trade currently. Let us roll through the different charts.
First of all, on GDX, the SCTR has been glued to the top. We can see it looks exceptional. In the next pane is the relative strength compared to the $SPX. The trend is still up, but recently the GDX and the $SPX have been moving sideways for a month as the early July and Early August peaks are at the same levels.
The price panel shows a defined uptrend that made a higher high this morning and closed back in the range. The MACD is going to break either trend line shortly. For the volume, I want to zoom in on the last 6 months.
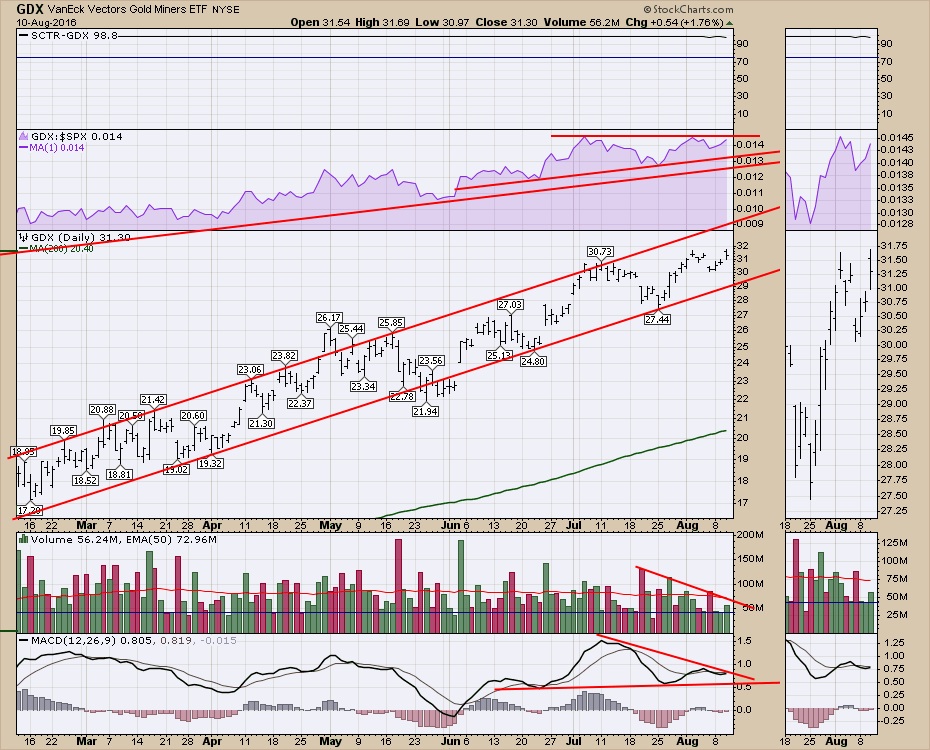
By zooming in on the last six months, we can get a close up of the volume. I have placed a horizontal line at Tuesday's low volume reading. One of the things that seems to be changing is the volume setup. For 3 of the last 4 up days, and four of the last 5 days, the volume has been very low relative to the whole trend. There were only 3 up days in the last 6 months with this level (44 million shares) of volume prior to this week. Now we have three inside of one week (Thursday, Monday, Tuesday). That puts my antenna up to look for changes.
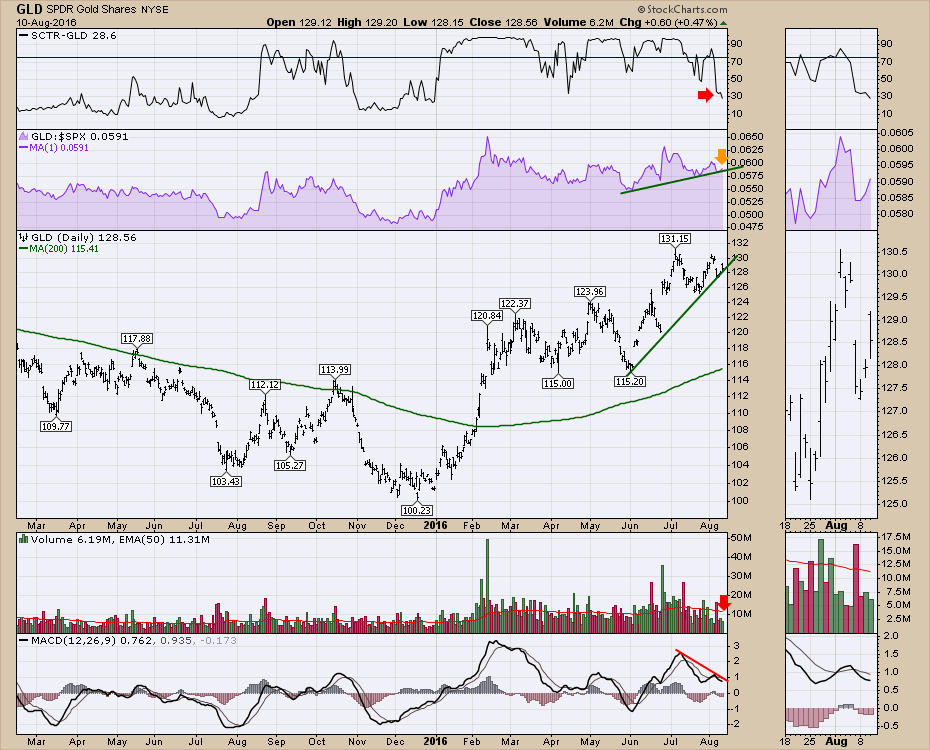
 Interestingly enough, the chart for the price of gold using GLD has some differences starting to show up.
First of all, the SCTR for GLD is at the lowest level since the rally started. Below 30 suggests something is changing. The relative strength has been performing in line with the $SPX for the last five months. Currently, there is a small trend line shown in green than is being tested on the relative strength panel. Interestingly, Gold is up 30% from the December lows and the $SPX is up 25% from the February lows. The trend line from the June low is being tested more and more recently. The MACD just made a lower high so this is getting pretty interesting. I'll zoom in to look at the volume.
 Below is the same chart with the volume closeup using a horizontal line with today's volume. 7 of the last 8 days have had volumes close to half of the 50-period EMA. You can look in the zoom box to get a little better detail. Once again, there are only 5 or 6 days in the 6-month run that had volume down at these levels and they were usually one-offs.
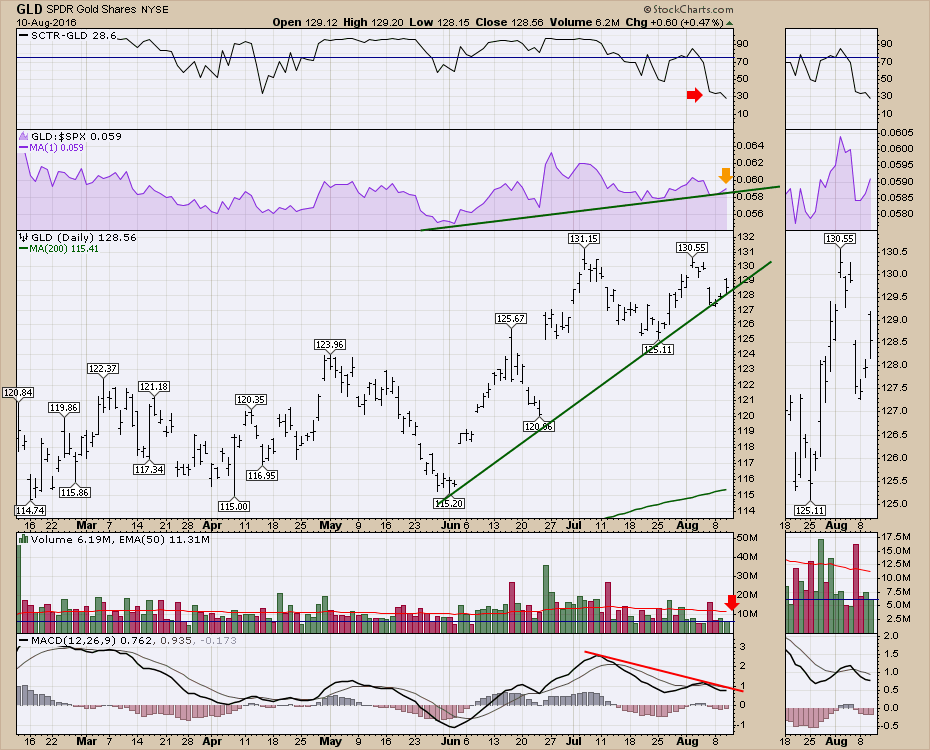 Currently, the volume on both ETF's seems to be awfully weak if the major trend is to continue. There is also divergence on the MACD's on both charts. I'll be talking more about this on the Commodities Countdown 2016-08-10 webinar at 5 ET.
You can also follow me on twitter @Schnellinvestor and LinkedIn. If you would like to receive this commodity-based series in your email, please click on the subscribe button below. This blog is focused on Commodity investing ideas.
Good trading,
Greg Schnell, CMT, MFTA
