 DecisionPoint timing models are tracked by Timer Digest, a professional journal for technical analysis timing. Per their website, "Timer Digest monitors over 100 of the nations leading market timing models, ranking the top stock, bond, and gold timers according to the performance of their recommendations over the previous 52 weeks." Currently, I'm listed on the cover tied for first mid-year for Bond Timer of the Year. I'll tell you that our Intermediate-Term Trend Model (ITTM) which is used to "time" our positions has been the reason. Last year, I came in 2nd, narrowly missing the title.
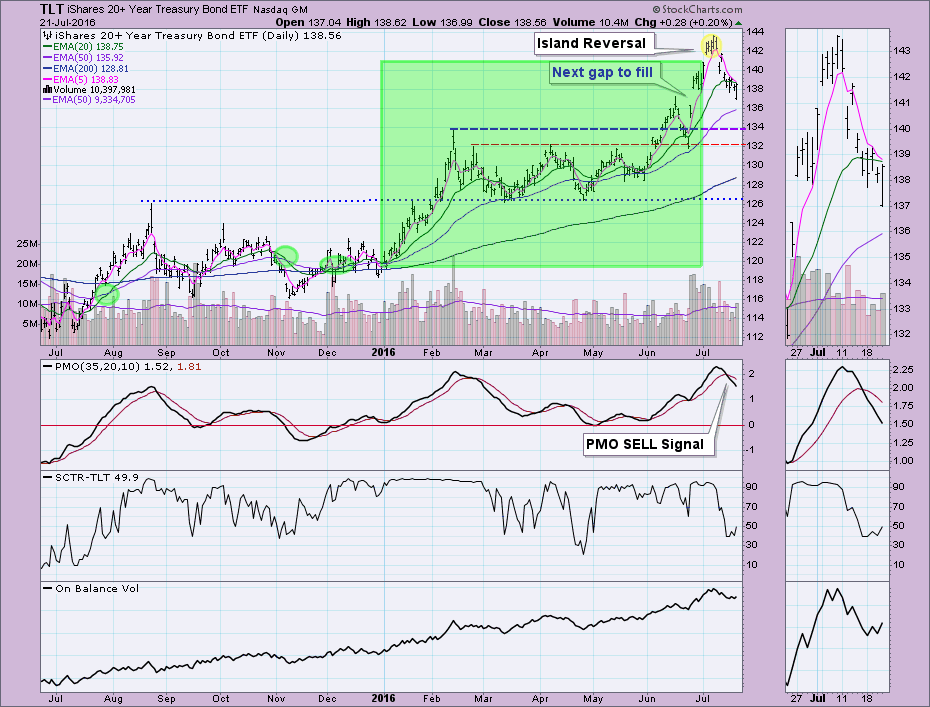
The ITTM has actually been on a BUY signal for the past six months, and consequently I'm ranked number one. The ITTM initiates a new signal each time the 20-EMA crosses the 50-EMA with a positive crossover triggering a BUY signal and a negative crossover generating a Neutral or SELL signal (50-EMA > 200-EMA = Neutral signal, 50-EMA < 200-EMA = SELL signal). Our signals switched back and forth during the end of last year and likely were the culprit to just missing out on the title. I've annotated previous signal changes and have highlighted the first six months of this year. Currently, in the short term, TLT has formed an island reversal pattern. It has executed and the first gap was filled. At this point, we are waiting for the second gap to finish filling. Strong support lies at about 134 and I suspect that will the reversal point. Based on the declining Price Momentum Oscillator (PMO) and mediocre SCTR, I suspect we will see a drop to that line of support at a minimum.
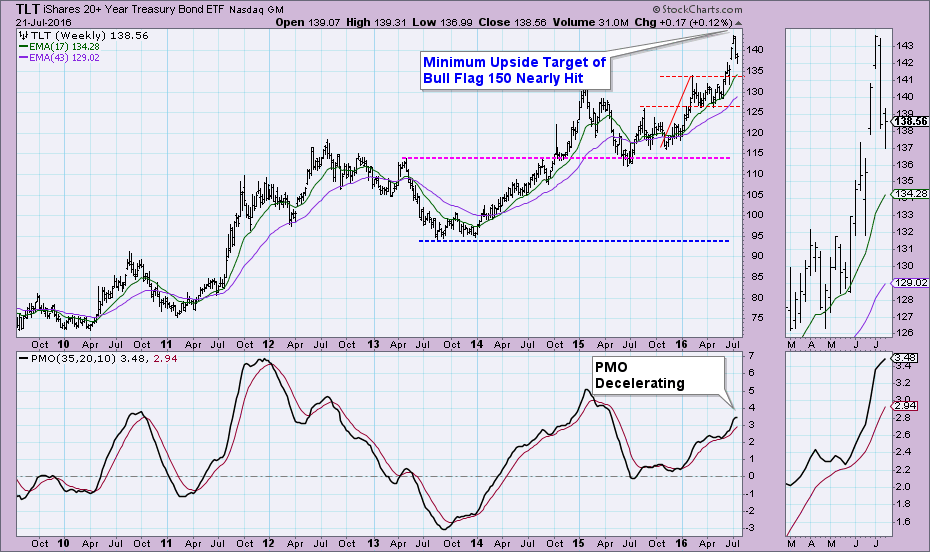
On the weekly chart, I identified a bullish flag formation which came close to reaching its upside target of about 150. The weekly PMO is not at the top of its range, but it is decelerating somewhat. Should support be found around 134, the weekly PMO should turn back up before a negative crossover.
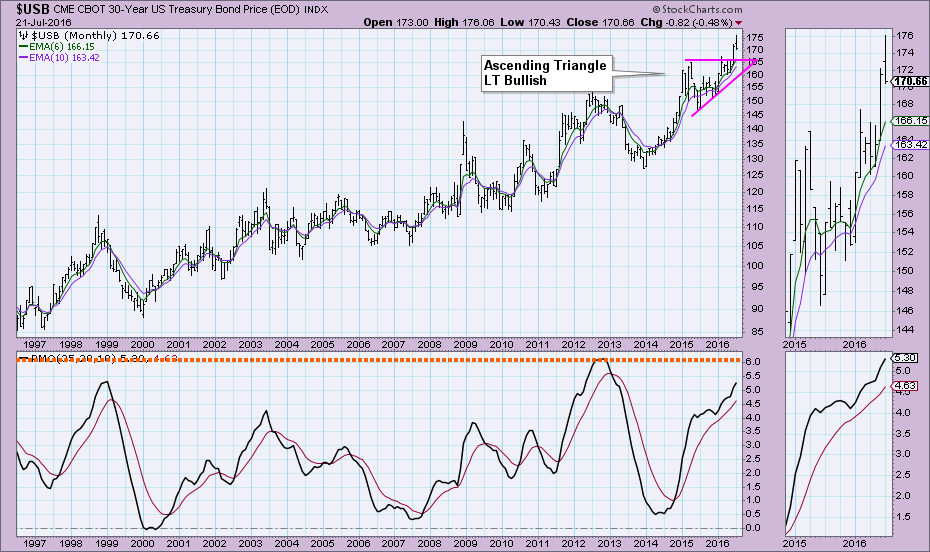
The monthly chart is somewhat concerning. Price did complete the ascending triangle pattern with the expected upside breakout. However, of concern is a monthly PMO near the top of its range.
Conclusion: I'm expecting a short-term decline that will terminate around 134 which was previous resistance at all-time highs. The intermediate-term picture is showing some deterioration but also suggests that support will be found around 134. The long-term monthly chart could be considered bearish based on the PMO reaching the top of its range and could suggest a correction coming in the next few years. For now, our DecisionPoint timing model remains on an intermediate-term BUY signal which could push me to a Bond Timer of the Year title if support is found. If not, a negative 20/50-EMA crossover is likely which would move us to Neutral, meaning fully hedged or in cash.
Come check out the DecisionPoint Report with Erin Heim on Wednesdays and Fridays at 7:00p EST, a fast-paced 30-minute review of the current markets mid-week and week-end. The archives and registration links are on the Homepage under “What’s New”.
Technical Analysis is a windsock, not a crystal ball.
Happy Charting!
- Erin


