Latest News
The Mindful Investor14h ago

200-Day Moving Average Confirms Bearish Phase
When markets get more volatile and more unstable, I get the urge to take a step back and reflect on simple assessments of trend and momentum Read More
Stock Talk with Joe Rabil18h ago
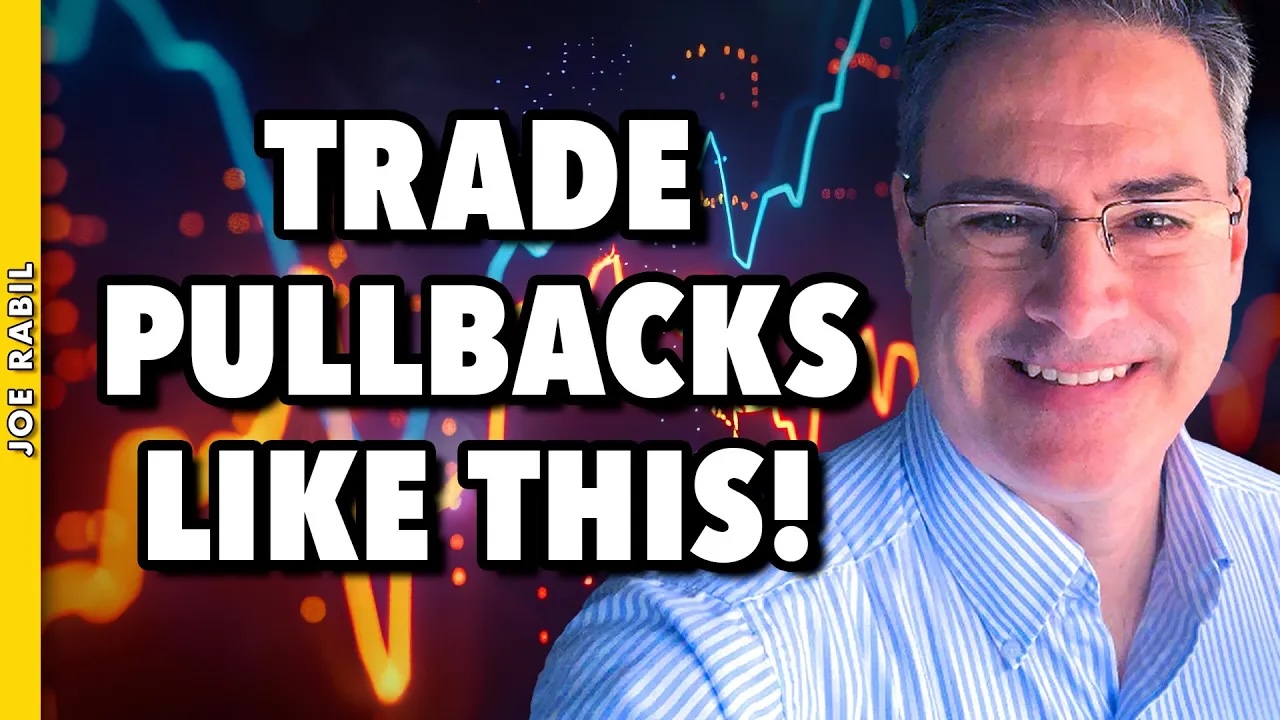
Trade Pullbacks Like a Pro: Simple Moving Average Strategy That Works
Moving average strategy, trend trading, and multi-timeframe analysis are essential tools for traders. In this video, Joe demonstrates how to use two key moving averages to determine if a stock is in an uptrend, downtrend, or sideways phase Read More
Add-on Subscribers
OptionsPlay with Tony Zhang1d ago
How to Time Your Trades For Faster Gains
When working with probabilities, you want to place trades that maximize your returns while minimizing your risks. In this OptionsPlay members-only video, Tony Zhang walks you through the techniques professional traders use to identify optimal entry points Read More
ChartWatchers1d ago

Secure Your Retirement Happiness: Check Your 401(k) Now!
With so many articles and videos on popular media channels advising you not to look at your 401(k) during this market downturn, avoiding taking the other side is tough Read More
ChartWatchers1d ago

Is This the Confidence Trap That Could Wreck Your Retirement Portfolio?
If last weekend's tech tariff exemptions teach us anything, it's this: trying to make near-term market forecasts based on tariff assumptions is a fool's errand Read More
The Mindful Investor2d ago

Bullish Percent Index Confirms Short-Term Rebound
One of my favorite market breadth indicators remained in an extreme bearish reading through the end of last week, standing in stark contrast to growing optimism after last Wednesday's sudden spike higher Read More
Members Only
Martin Pring's Market Roundup2d ago
Gold is at a Record High -- Is There a Message?
The recent rally in the gold price has not yet attracted the kind of gold fever associated with the 1980 peak Read More
DecisionPoint3d ago
DP Trading Room: SPX Earnings Update
The market has been overvalued for some time but how overvalued is it? Today Carl brings his earnings chart to demonstrate how overvalued the market is right now. We have the final data for Q4 2024 Read More
RRG Charts3d ago
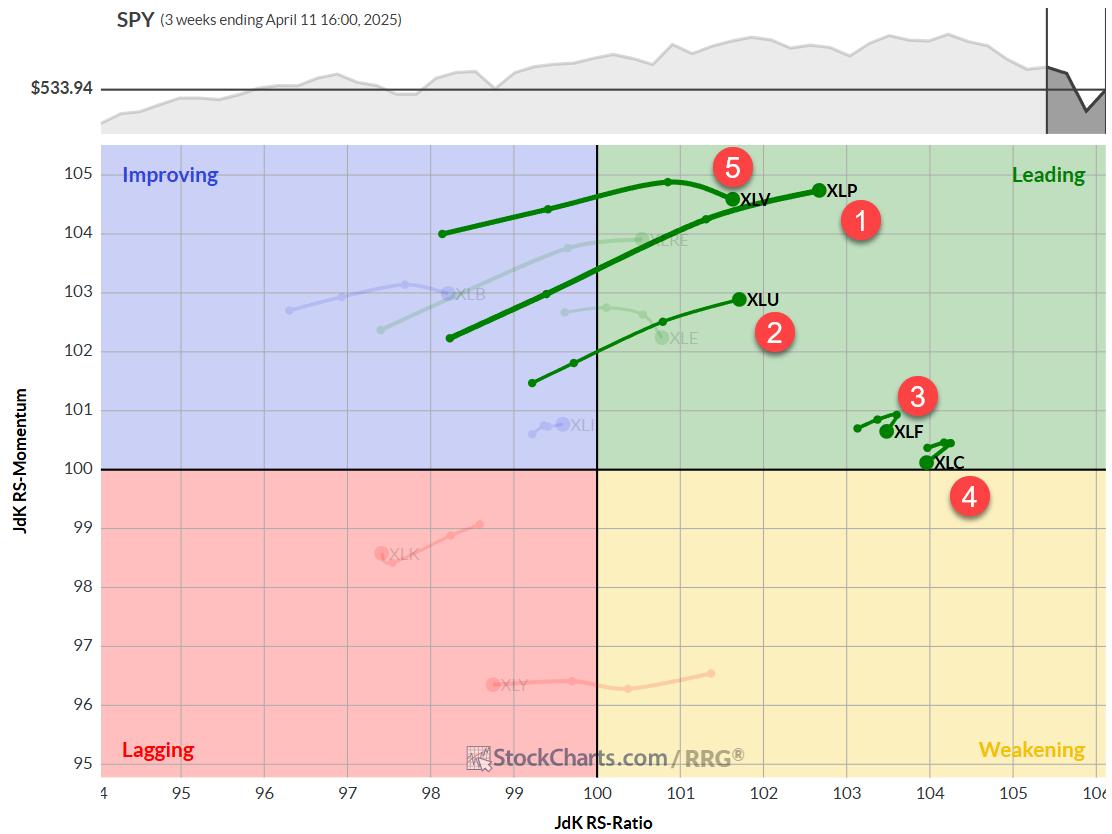
The Best Five Sectors, #15
Healthcare Re-Enters the Top 5 After a wild week in the markets, the sector ranking got quite a shake-up. Although only one sector changed in the top 5, the entire top 5 changed positions. In the bottom half of the ranking, only two sectors remained stationary Read More
Art's Charts3d ago

An Oversold Bounce is One Thing - A Bullish Breadth Thrust is Another
Panic selling and oversold extremes gave way to a rip higher last week. Stocks are poised to open strong on Monday as the market reacts positively to tariff news. Last week's bounce is considered an oversold bounce within a bear market Read More
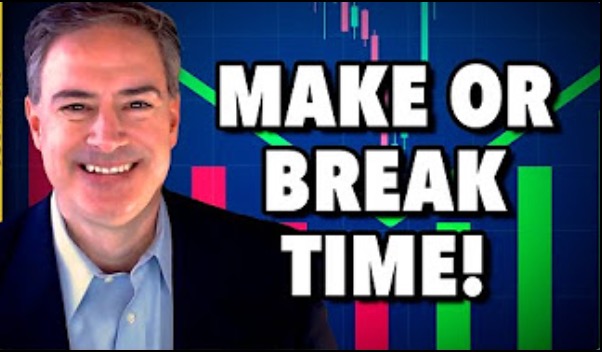
Trading Places with Tom Bowley3d ago

The Bottom is Here or Rapidly Approaching
I pay attention to technical support levels as the combination of price support/resistance is always my primary stock market indicator Read More
Analyzing India5d ago
New US Tariffs and Intensifying US–China Trade War: Economic Implications and Opportunities for India
In 2024-2025, the United States significantly escalated its trade conflict with China through new tariffs, including a substantial 100% tariff on electric vehicles and 50% on essential technologies like semiconductors and solar products Read More
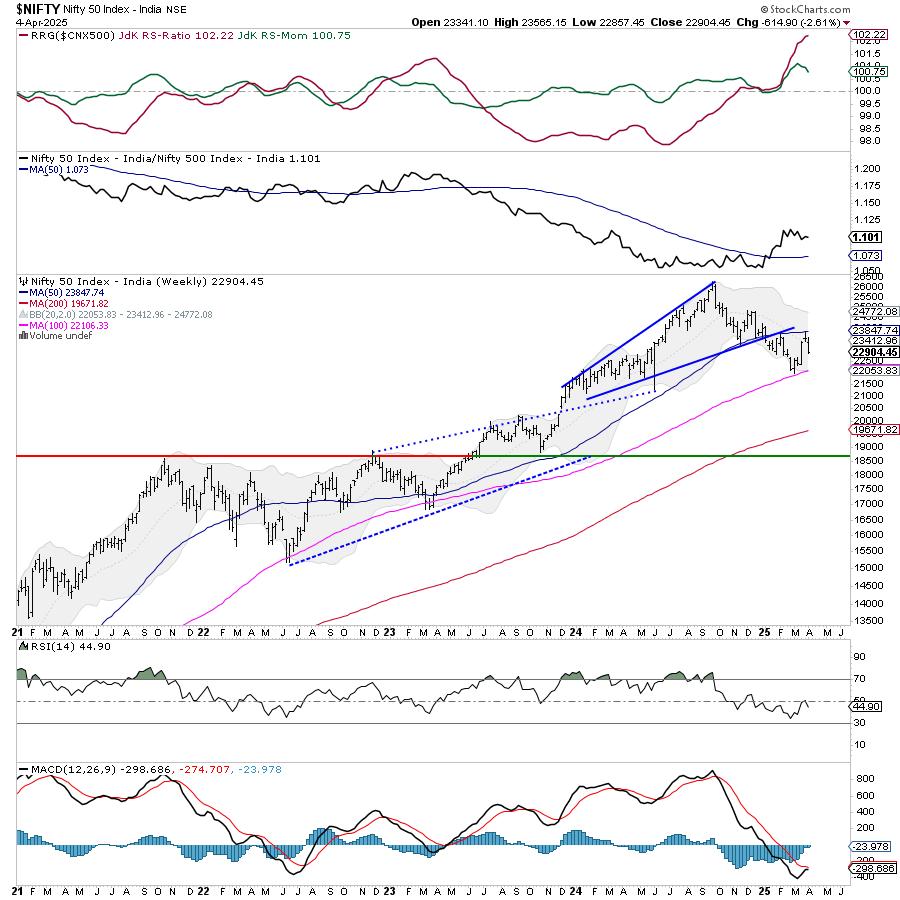
Analyzing India5d ago
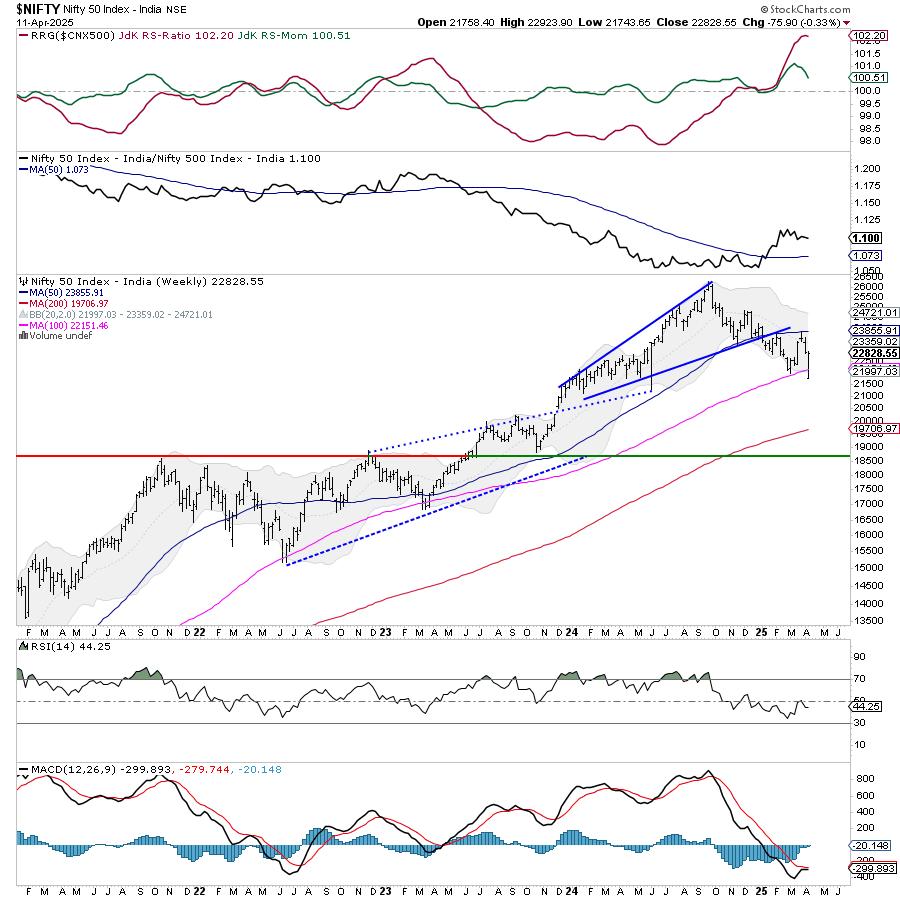
Week Ahead: NIFTY May Continue Staying Volatile; Focus On These Levels
The previous weekly note categorically mentioned that while the markets may continue to decline, the Indian equities are set to outperform its global peers relatively Read More
The MEM Edge5d ago

Market Rally or Fakeout? How Politics and Earnings Are Driving Stocks
Stock market rally, sector rotation, and earnings movers dominate this week's analysis with Mary Ellen McGonagle. In this video, Mary Ellen reviews where the market stands after last week's bounce and explains how White House activity drove major price action Read More
ChartWatchers5d ago

Investors on the Move: A Visual Guide to the Stock Market
Another interesting week in the stock market comes to an end. The past few days were flooded with the twists and turns of President Trump's reciprocal tariffs, which were later put on a 90-day pause except for China, which got hit with higher tariffs Read More
A View From The Floor5d ago
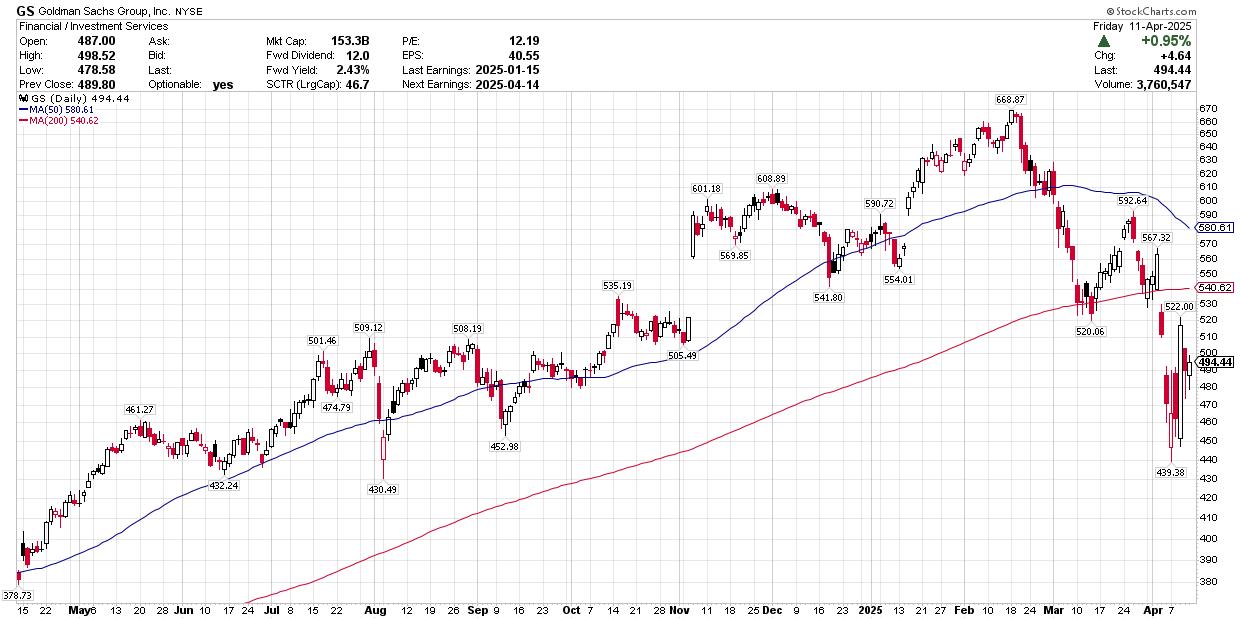
Earnings From These 3 Stocks Could Be Key
This week, we're getting back to earnings season during the shortened four-day period. Goldman Sachs Group, Inc. (GS) reports on the heels of JP Morgan's solid results that saw its shares rally by 12.3% and recapture its 200-day moving average Read More
StockCharts In Focus5d ago
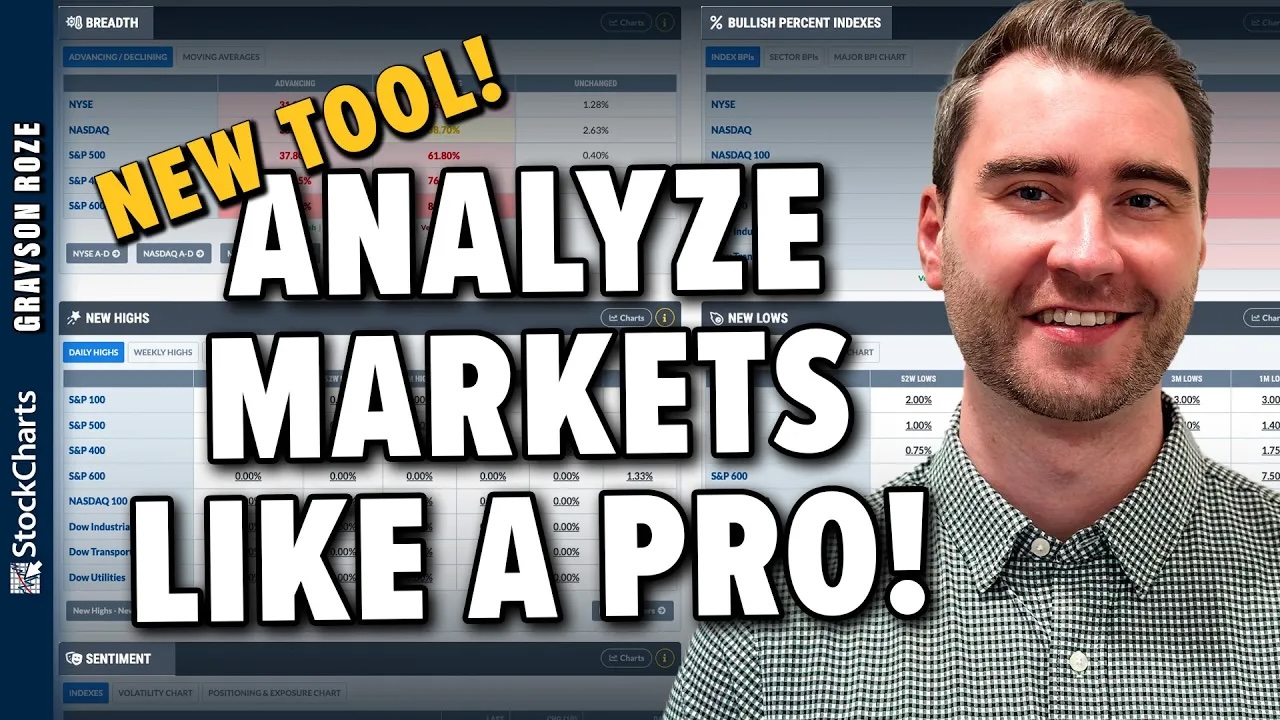
Master the Market: A Guide to StockCharts' New Market Summary Page
Stock market analysis, technical indicators, and market trends are crucial for informed investing. StockCharts is making those things easier, and Grayson Roze is here to show you how. In this video, Grayson provides an in-depth walk-through of the all-new Market Summary Page Read More
ChartWatchers6d ago

Trade War Mayhem? Here's How to Cut Through the Noise!
The current tariff environment is full of sudden moves that could have broad and long-lasting effects Read More
Art's Charts6d ago

This Report Might Self Destruct in 5 Days
In the opening scene of Mission Impossible 2, Ethan Hunt receives a message at the top of a sandstone butte. He puts on the glasses and listens to the message, which ends with the computer-generated phrase: "This message will self-destruct in five seconds Read More
The Mindful Investor6d ago

Is the Stock Market Getting Ready to Bounce? Key Market Breadth Signal Explained
When the stock market slides significantly, it's natural to question if the market has bottomed and getting ready to bounce. In this video, David Keller, CMT highlights the Bullish Percent Index (BPI) as a key indicator to monitor during corrective moves Read More
DecisionPoint1w ago

S&P 500 Final 2024 Q4 Earnings: Still Overvalued
S&P 500 earnings are in for 2024 Q4, and here is our valuation analysis Read More
ChartWatchers1w ago
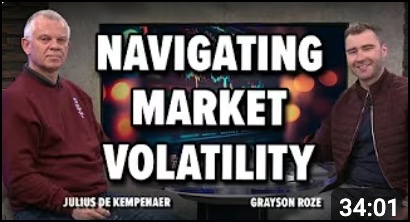
Stock Market Volatility: Pain Points, Bright Spots, and Strategies
Is the stock market volatility making you nervous? In this video, Grayson Roze and Julius de Kempenaer unpack the volatile market environment and discuss pain points, some of the "bright spots" they are seeing in the market, and the StockCharts tools they are using to identify sh Read More
ChartWatchers1w ago

Mastering Stock Market Turbulence: Essential Insights for Investors
Tariff turmoil continues sending the stock market into a turbulent spin. Tariffs went into effect at midnight, which sent equities and bond prices lower Read More
Members Only
Martin Pring's Market Roundup1w ago
Are the Tariffs Bullish or Bearish for the US Dollar?
Tariffs have been front and center of market attention, but one asset class that has been relatively subdued in its response has been the US Dollar Index Read More
Stock Talk with Joe Rabil1w ago
Key Levels for the S&P 500: Has It Bottomed?
Is the stock market on the verge of crashing or has it bottomed? In this video, Joe Rabil uses moving averages and Fibonacci retracement levels on a longer-term chart of the S&P 500 to identify support levels that could serve as potential bottoms for the current market correction Read More
DecisionPoint1w ago

DP Trading Room: Key Support Levels for the SPY
The market is in a tailspin as tariffs add volatility to the market. Carl and Erin believe the SPY is in a bear market given key indexes like the Nasdaq are already in bear markets. It's time to consider where the key support levels are Read More
RRG Charts1w ago

The Best Five Sectors, #14
This article was first posted on 4/4/2025 and contained only rankings and charts Read More
The MEM Edge1w ago

Market Drop Compared to 2020: What You Need to Know Now
How low can the S&P and the Nasdaq fall? More importantly, how can an investor navigate this volatile environment? In this eye-opening video, Mary Ellen McGonagle delves into the stock market's fall, identifies key support levels, and compares them to past bear markets Read More
Analyzing India1w ago
Week Ahead: NIFTY Set To Open Lower; Relative Outperformance Against Peers Expected To Continue
The previous week was short; the Indian markets traded for four days owing to one trading holiday on account of Ramadan Id Read More
ChartWatchers1w ago

Demystifying Tariff Impact: Essential Insights for Every Investor
The stock market hoped for curtailment of tariffs on Wednesday, but that didn't happen. Even the better-than-expected March non-farm payrolls weren't enough to turn things around Read More
A View From The Floor1w ago
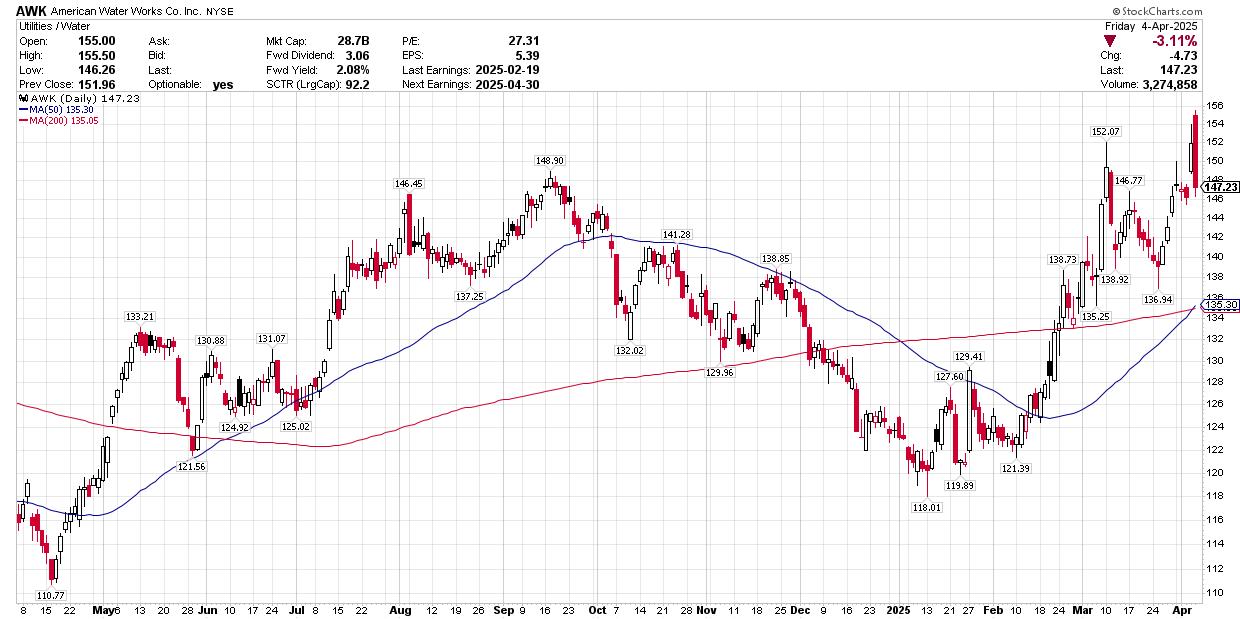
Three Stocks to Watch: Utilities, Banks, Airlines
When markets are sliding lower, where should you be investing? Here are three stocks to consider Read More
Art's Charts1w ago

Bitcoin Holds Up, but Remains Short of Relative Breakout
Stocks are in a freefall with selling pressure spreading into industrial metals and other economically sensitive commodities. There are few places to hide in bear markets, and the list of alternatives continues to shrink Read More
The Mindful Investor1w ago

Three Defensive Plays for Post-Tariff Survival
With the S&P 500 and Nasdaq dropping quickly after this week's tariff announcements, investors are scrambling to identify areas of the market demonstrating strength despite broad market weakness Read More
Stock Talk with Joe Rabil2w ago
Trend-Following Stocks: How a Low ADX Can Signal Huge Breakouts!
In this exclusive StockCharts video, Joe Rabil shows you how to use the ADX on monthly and weekly charts to find stocks with massive breakout potential. Joe walks you through several examples of stocks and ETFs that broke out of an extended period of trading sideways Read More
Members Only
Martin Pring's Market Roundup2w ago
Sentiment Is Near-Perfect for a Rally: One Thing Could Stand In the Way
Several sentiment indicators I follow have reached the kind of level of disbelief that has traditionally fueled a worthwhile rally or even jump-started a new bull market Read More
ChartWatchers2w ago

BSX Stock Slump? Discover This Winning Option Strategy
When the stock market lacks clear direction, options strategies can be a dependable friend. I often go through the OptionsPlay ChartLists in StockCharts to look for stocks that show potential trading or investing opportunities Read More
ChartWatchers2w ago

Get Paid to Buy Your Favorite Stocks Using This Options Strategy
Did you know you can generate more than a 5% monthly yield by utilizing an options strategy? In this educational video, Tony Zhang walks you through an income-generating options strategy using the OptionsPlay Strategy Center on StockCharts.com Read More
Don't Ignore This Chart!2w ago

AU Surges Above Resistance: Here's How to Take Action
As precious metals surge on safe-haven demand, some gold mining companies are following suit. One standout is AngloGold Ashanti Ltd. (AU), which has been riding this upward momentum Read More
ChartWatchers2w ago

Top 10 Stock Charts for April 2025: Big Breakouts Ahead?
Finding stocks that show promising opportunities can be challenging in a market that goes up and down based on news headlines. But, it's possible Read More
DecisionPoint2w ago

DP Trading Room: Magnificent Seven Stocks in Bear Markets
You may not know it, but all of the Magnificent Seven stocks are in bear markets. Given they are such an integral part of the major indexes, we have to believe that the market will follow suit and continue lower in its own bear market Read More
Popular Articles
The Bottom is Here or Rapidly Approaching
This Report Might Self Destruct in 5 Days
Investors on the Move: A Visual Guide to the Stock Market
Bullish Percent Index Confirms Short-Term Rebound
An Oversold Bounce is One Thing - A Bullish Breadth Thrust is Another
Trade War Mayhem? Here's How to Cut Through the Noise!
Get expert technical commentary delivered straight to your inbox! Sign up for our FREE weekly ChartWatchers Newsletter. Learn More
Featured Authors


Public ChartList Leaders


StockCharts Members unlock complete access to the Stocks & Commodities Magazine archives. Read the latest articles or browse past editions.