Don't Ignore This Chart! April 30, 2009 at 10:48 AM
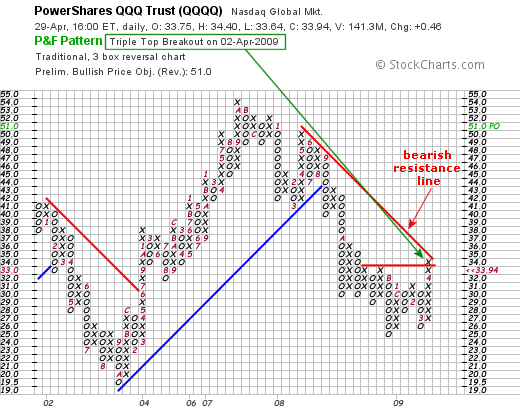
A run through the PnF scans reveals a triple top breakout for QQQQ on Wednesday. This means prices pushed the current "x" above the prior two highs (green arrow)... Read More
Don't Ignore This Chart! April 29, 2009 at 04:22 PM
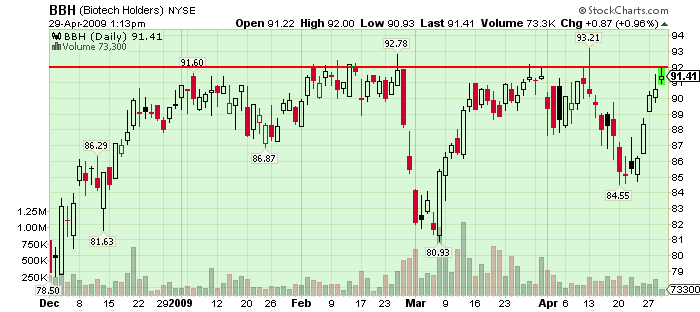
Click here for a live version of this chart. The Biotech ETF has had a devil of a time getting above 92 this year. Right now it is trying again. The low volume numbers don't bode well but remember that ETF volume data can be tricky to interpret... Read More
Don't Ignore This Chart! April 27, 2009 at 08:09 PM
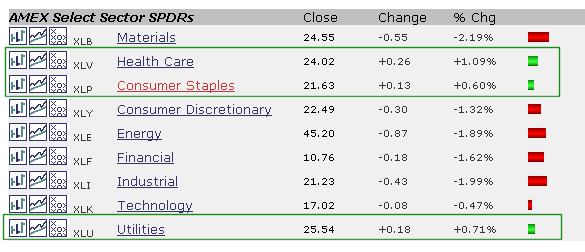
The healthcare, utilities and consumer staples sectors are traditionally the defensive sectors that underperform during a broad market advance. This was the case in March and most of April... Read More
Don't Ignore This Chart! April 25, 2009 at 06:13 PM
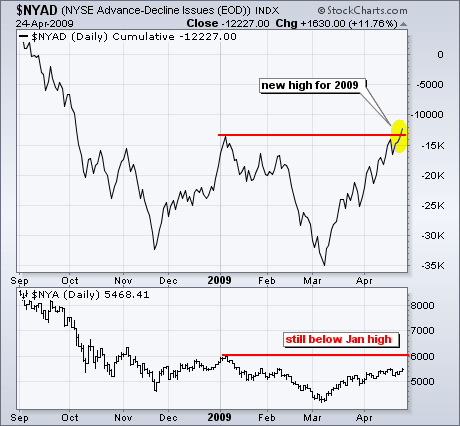
The NYSE AD Line moved above its January high to record a new high for 2009. In contrast, the NY Composite Index remains below its January high... Read More
Don't Ignore This Chart! April 23, 2009 at 08:53 PM
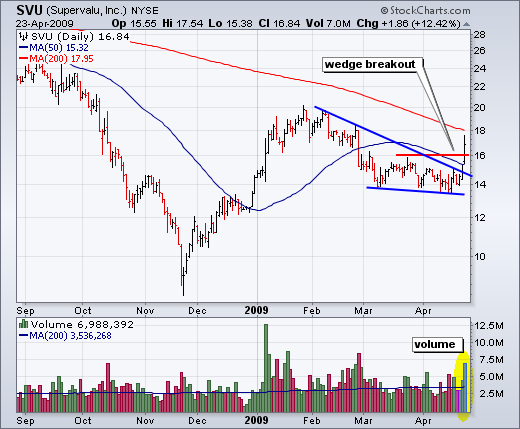
Super Value (SVU) surged above its 50-day moving average and wedge resistance with a big move on big volume... Read More
Don't Ignore This Chart! April 22, 2009 at 08:32 PM
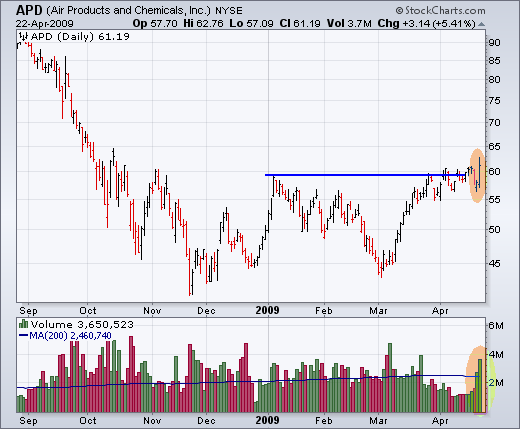
Air Products (APD) is part of the chemicals group and the basic materials sectors. After surging to resistance in March, the stock consolidated around the 60 the last few weeks... Read More
Don't Ignore This Chart! April 21, 2009 at 05:25 PM
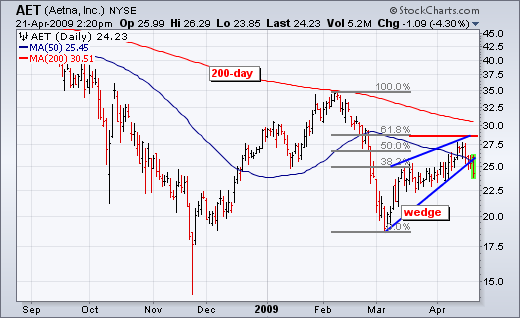
Aetna (AET) retraced 62% of the Feb-Mar decline with a rising wedge that peaked in mid April. Both the wedge and the retracement are typical for corrective rallies within bigger downtrends... Read More
Don't Ignore This Chart! April 20, 2009 at 06:40 PM
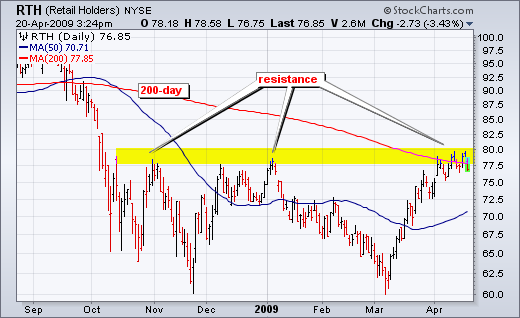
The Retail HOLDRs (RTH) hit massive resistance around 78-80 for the third time since October. Resistance in this area stems from the October, January and April highs. In addition, the falling 200-day moving average is coming into play... Read More
Don't Ignore This Chart! April 20, 2009 at 06:37 PM
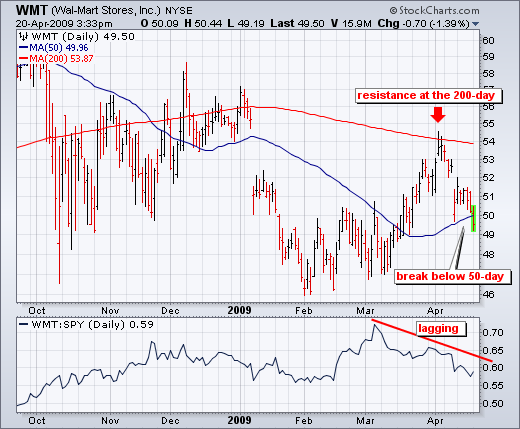
Wal-Mart (WMT), which is the biggest component in RTH, is leading the way lower with a break below its 50-day moving average on Monday. Notice that WMT peaked at the 200-day moving average on 2-April and did not follow the broader market higher over the last two weeks... Read More
Don't Ignore This Chart! April 16, 2009 at 08:25 PM
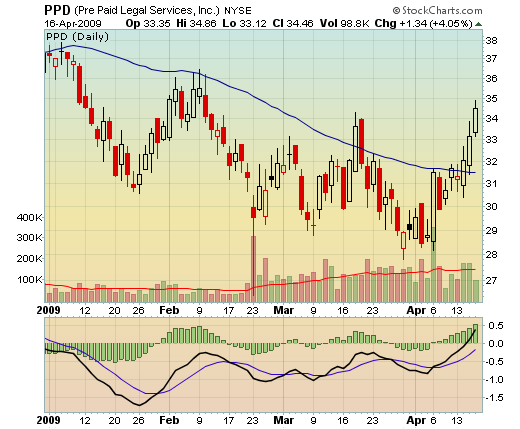
Click here for a live version of this chart. We discussed PPD and its long struggle with the 50-day MA in a previous post... Read More
Don't Ignore This Chart! April 16, 2009 at 01:49 PM
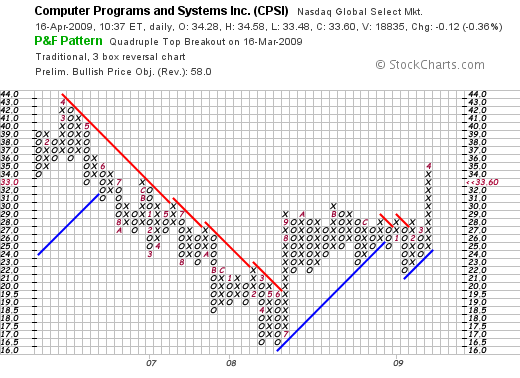
Click here for a live version of this chart CPSI has had a pretty impressive P&F chart for a while now. On March 16th, it completed a Quadrupal Top Breakout pattern that is, technically, still in place today... Read More
Don't Ignore This Chart! April 09, 2009 at 01:27 PM
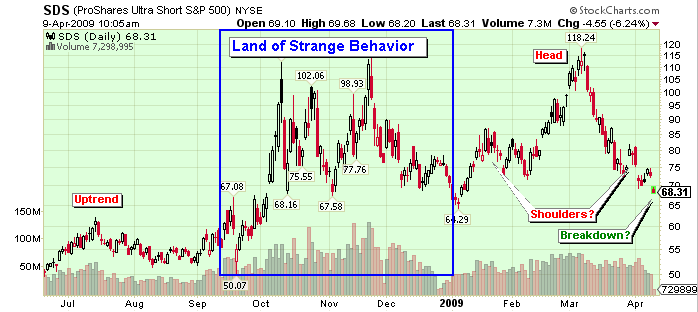
Click here for a live version of this chart SDS is the ProShares Ultra Short S&P 500 ETF. It's a way to invest (gamble really) that the market is going to fall. It showed up today on our Ticker Cloud page as one of today's most popular charts. A close look at the chart shows why... Read More
Don't Ignore This Chart! April 07, 2009 at 03:24 PM
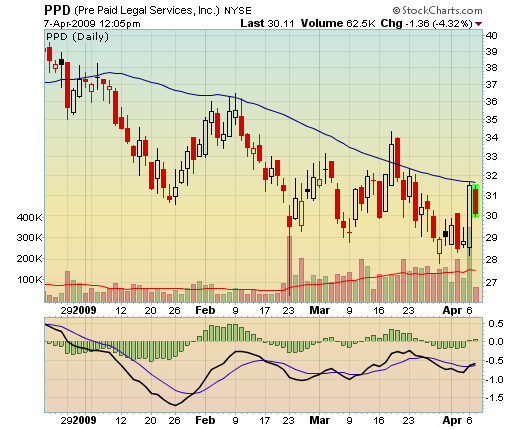
Click here for a live version of this chart Help! Police! Pre-Paid Legal Services (PPD) is getting beat down by its 50-day Moving Average! Again! This is the third time this year that PPD has failed to penetrate the 50-day MA (blue line)... Read More
Don't Ignore This Chart! April 03, 2009 at 07:12 PM
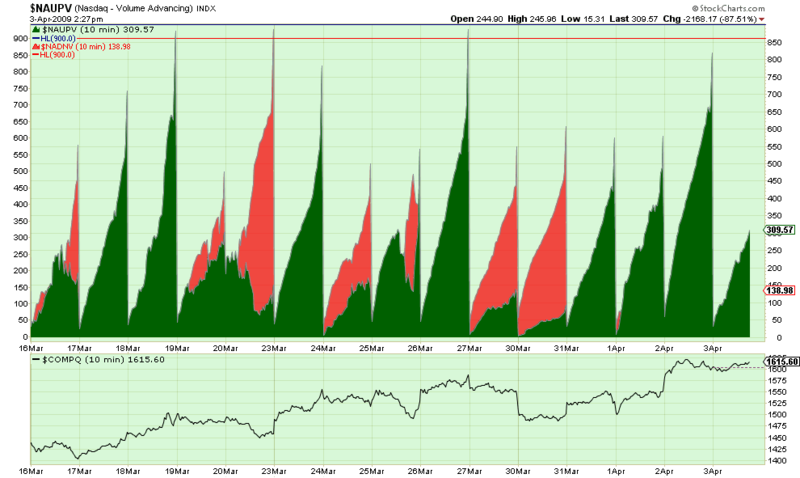
Click here for a live version of this chart. "Wow. That doesn't look like any financial chart I've ever seen before." I agree, that is one strange looking chart. What the green area shows is the total amount of "Up" volume - i.e... Read More