This article will look at the four currencies in the Eurozone that are part of $USD index.The Euro, the Swiss, the British Pound and the Krona.
Earlier today I published a currency article showing the Yen, the Aussie and the Canadian Dollar all just under important resistance. That article can be found here.
Currencies Are At The Decision Point
Starting at the top, the British Pound has been in an uptrend through most of 2013. In the first quarter it reached up to resistance levels from 2011 and 2009. What is very important to note is that the breaking of these levels to the topside would be very bullish and suggest the trend continues. However, for the $FTSE equity market, the rising pound has forced the equity market to oscillate all of 2013. The wedge is usually considered bearish but a sustained breakout either way should be a strong signal. If the Pound can break through the green resistance line, this will be a significant change in trend from sideways to rising on the long term.
The Swiss Franc is a unique chart. The parabolic spike in 2011 occurred as eurozone issues flared up and European investors sought the safety of the Swiss Franc. Looking at the current wedge under construction, I am also noticing a similar trend for the Swissie as the Pound was demonstrating. Near horizontal resistance and in a bearish wedge. If we start drawing a top line in the April 2013 time frame and extending it to now, it may look more like an upsloping channel. However, this large overview chart suggests this long red/green line is important with so many touches of support and resistance. If something dramatic was going to happen, would money flow to the Swissie or the $USD? We are about to find out which way the Swiss Franc is going to break.
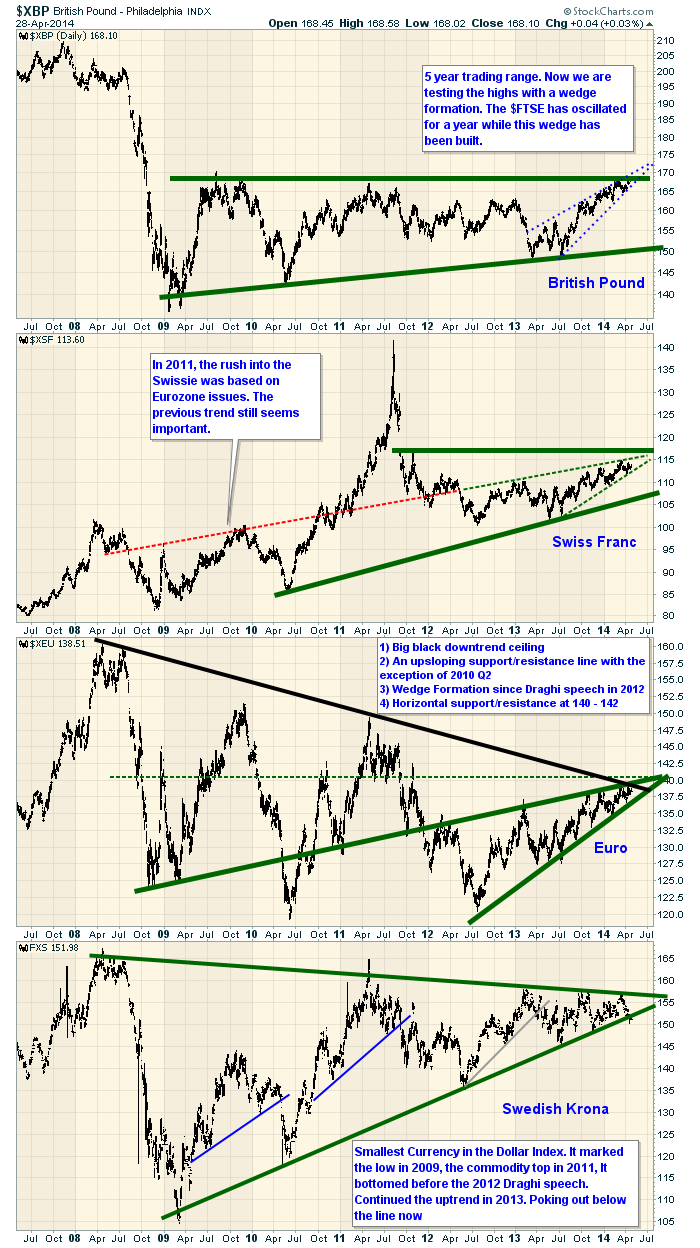
The Euro is a compelling chart. The solid black down trend line is showing its capacity to limit the global market. In both 2008 as well as 2011, this chart market the tops.Testing that line now should be a decision point for the overall markets.The Euro is 56% of the dollar index. We can also see the sloping uptrend line on the Euro that had one meaningful pullback in Q2 2010 where the line was not support. Again we see this wedge shape as we approach resistance. There is also horizontal resistance at 140 as shown with a dashed green line. A break down violates 1 trend line. A break to the upside above 140 would violate 3 lines.
Lastly, the Sweidsh Krona. While this is a small currency, it is ultra sensitive. When it started to make lower lows in 2008, that was a big message. The Krona bounced with the 2009 lows. The currency went on to top in April 2011 which was the start of the Euro zone issues. It pulled back to the 135 level after falling though support at 140. Throughout 2013 it made a series of lower highs which is different that the three currency plots above. Two weeks ago, it started to break below the 2009 trend line. It is also making lower lows than the last three months. Today it bounced back up to the previous support line. If this can get back in and stay there, it would be just a whipsaw. If it cannot retain the support of the green line, this sensitive currency may be the first currency indicator telling us about larger clues on direction.
Its a compelling time to watch the currency charts for hints on direction of equities.
Good trading,
Greg Schnell, CMT


