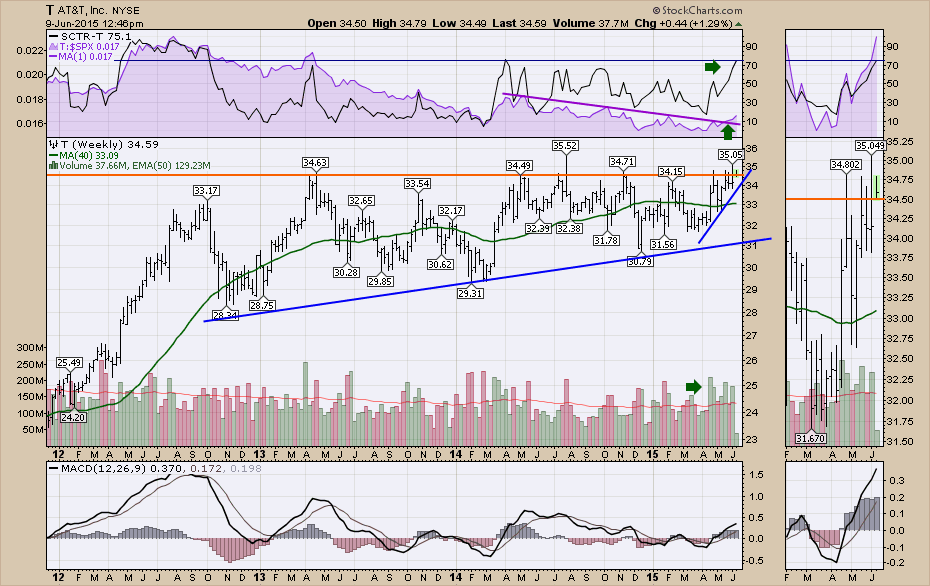
AT&T (T) continues to push higher. This week the SCTR has reached 75 again. Is the internet of things starting to kick in for the Telco's? Check out the rising lows on the consolidation for AT&T. 5 of the last 7 weeks have had big volume on up weeks.
The MACD has started a sustainable rise and looks set to continue. This $34.50 level in orange on the price plot continues to be resistance. Last week it broke above, but at the time of writing we are back at $34.59. The chart looks bullish and 2 weeks of closing above $34.50 would probably confirm the breakout with a tight stop underneath.
Good trading,
Greg Schnell, CMT

About the author:
Greg Schnell, CMT, MFTA is Chief Technical Analyst at Osprey Strategic specializing in intermarket and commodities analysis. He is also the co-author of Stock Charts For Dummies (Wiley, 2018). Based in Calgary, Greg is a board member of the Canadian Society of Technical Analysts (CSTA) and the chairman of the CSTA Calgary chapter. He is an active member of both the CMT Association and the International Federation of Technical Analysts (IFTA).
Learn More


