When we look back on 2016, we can add a few tips to our trading journals. Lots of key moments created great buying opportunities. After years of commodities being routed, it was a year for commodities to create fantastic returns. While many Main Stream Media channels focus on the commodities, the majority of the moves happen in the companies related to the commodities.
From the two sectors (Materials and Energy) that generated some phenomonal individual company returns, it is worth looking back to add tips into our trading journal for future use.
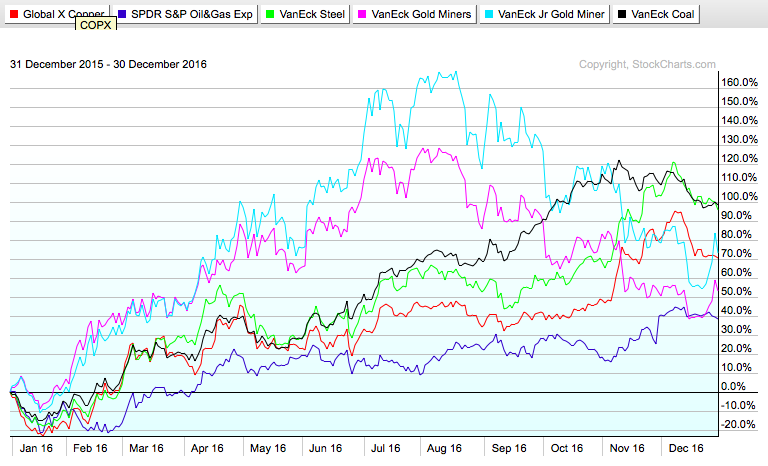
Here is the stellar chart showing how ETF's that average the companies in the industry group moved. Key Commodity Producer ETF's. Junior Gold Miners were up 160% on average by August! More 'Senior' Gold Miners peaked out at 130%, Steel and Coal related companies reached 120%, Copper at 95%, and the Oil and Gas E&P (Exploration and Production) companies only generated 45% at the peak!
Some of the individual large-cap companies had stellar years.
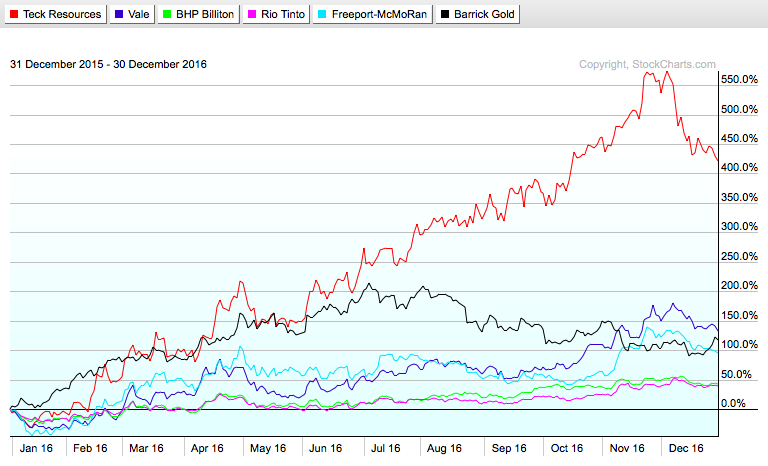 Looking at the specific commodity charts, they were really weak as a group starting the year. Everything had been in a downtrend for years. The bounce was huge!
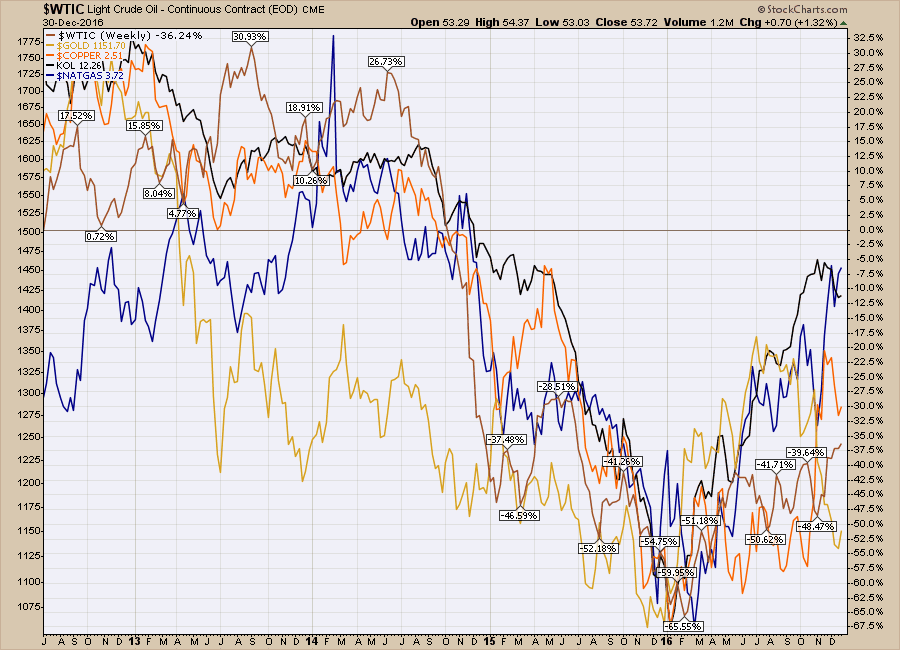 I had some notes on the $CRB chart all year which I put on as they happened. One of the big benefits of annotating charts is allowing the data to help you understand the importance of what you were watching at the time. Anglo-American, one of the largest companies in the space, announced they were going to lay off almost 2/3 of their staff! Look where that arrow ending up pointing. Pretty much on the lows for the entire commodity complex! However, there are also notes about Glencore and CAT that might have been potential bottoms.
A few years ago, Rare Earth Metals were all the rage in 2011. Gold and Silver were all the rage in 2011. Base metals in general were all the rage in 2011. Shale Oil was all the rage in 2014. Marijuana is all the rage in 2016. Lithium is all the rage in 2016. Can we learn from those previous groups? Let's take a moment and look at the leaders in Lithium and Marijuana.
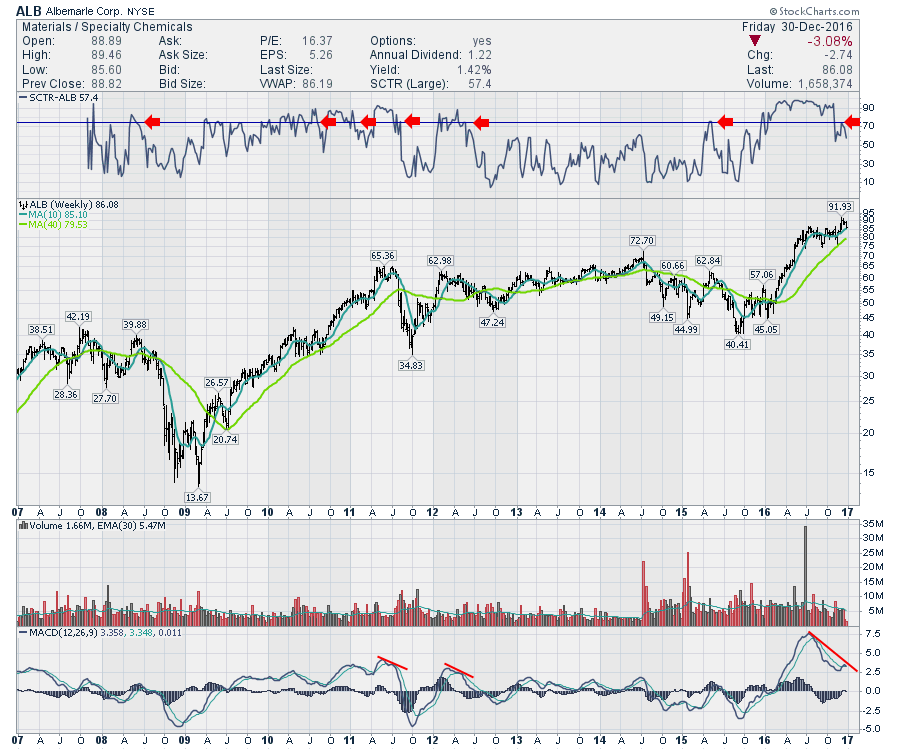
Here is a current Lithium stock. Albemarle (ALB). It has been one of the leaders in the industry with SQM and FMC. In both 2011 and 2012, ALB became a top performing stock when the SCTR moved above 75. But more importantly, the trend changed when ALB stopped being a top performing stock. It spent almost 4 years with an SCTR under 50. That means it's price action compared to the large cap SCTR group was in the bottom 50% of the market. You can't outperform when you are not outperforming. Why own an under performer?
In 2016, Albemarle went above 75 in January 2016 and the stock went on a tremendous run. Now look at the signal on the SCTR. On the most recent high, the trend of outperforming is starting to diminish as it fell below 75, then failed to get back above it on the rally. To confirm, the MACD is putting in a dramatically lower high in momentum compared to price at a new high. Exiting a great trade is very important. This looks like a beautiful reason to take profits. If it starts to outperform in 2017 again, we'll have a reason for a new entry. FMC looks strectched and SQM just had the SCTR fall below 75. Caution is warranted in the industry group for 2017.
 Let's move onto the new industry of Cannabis. In Canada, where I live, our business news channel has a Cannabis industry CEO on every week for interviews. The Prime Minister campaigned on legalizing Marijuana. The Marijuana stocks went on a fabulous run. But for investors, leaving a great trade is so important to making large profits. Commodities are riddled with parabolic finishes. Understanding how to invest in them is probably more important than most trading styles, because the losses mount ferociously quick! In this example below, the largest marijuana stock surged 550 % over 4 months. On the day of the high, the stock had a 40% move!!
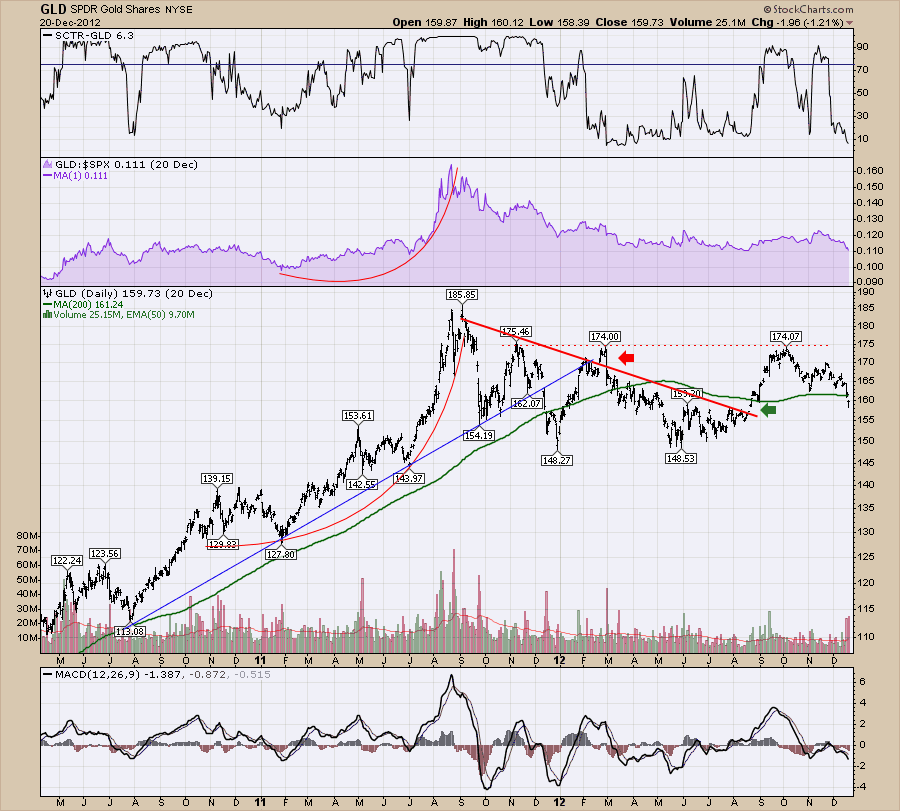
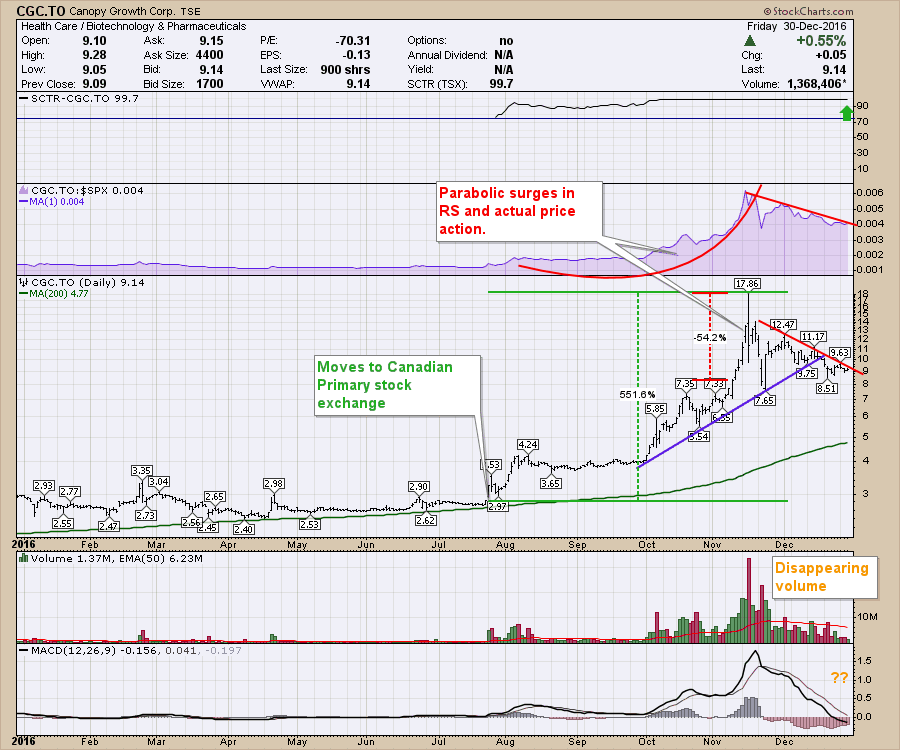 We can go back and look at how Gold traded in 2011.The actual trading pattern may not match, but the emotions of traders during parabolic spikes rarely fails to disappoint. What might we expect? We could expect a false breakout with a ripping reversal that never gives the breakout buyer another chance to get even for years! We could expect a meaningful breakout a year or so down the road. There is still a lot of emotion in CGC.TO that probably needs time to move the stock from weak hands to strong hands. My suggestion would be to stay extremely nimble as an investor in Marijuana related stories for the upcoming year. The US election is over and the states that have adopted more liberalized laws towards Cannabis have already voted on this subject. Looking at the industry currently, it has all the makings of meaningful, multi year top in place. It may be different this time, but stay nimble.
Outlook for 2017:
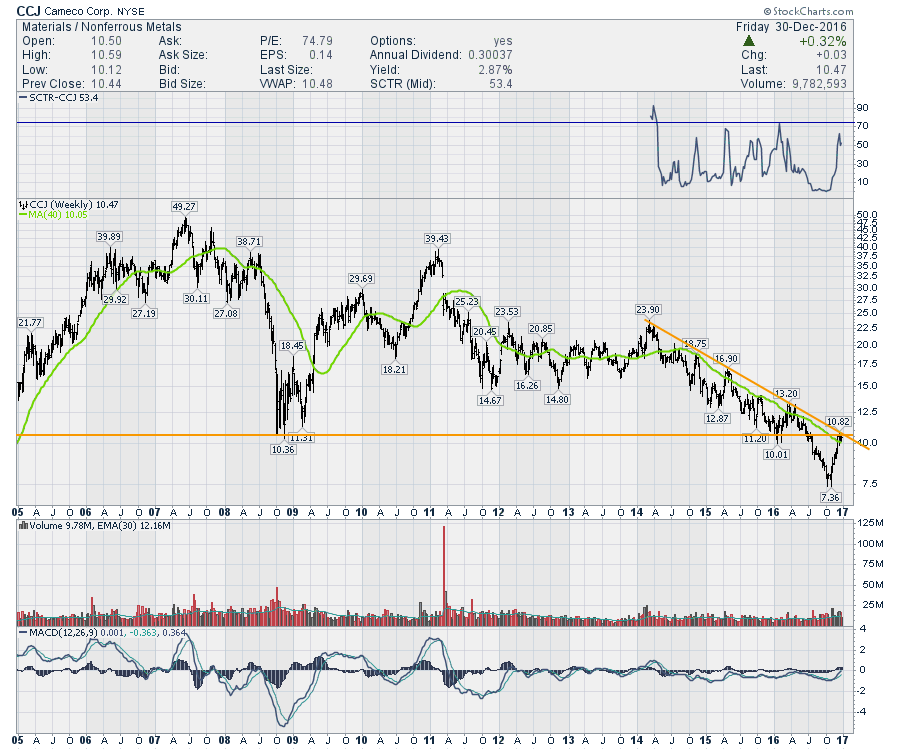
One of the areas of beaten down reversals may come in the form of Uranium. The big 800 pound gorilla is Cameco (CCJ). As you can see on the chart below, we are at the horizontal support / resistance and the downtrend line. Worth watching as this could be the commodity stock story for 2017.
 I do think there is an important message in the commodity charts in general.
When the oil price soared to $149 back in 2008, this price was high enough to allow a lot of development in alternative fuels. At the end of 2016, we have not seen a major breakup in any of the industry groups. Wind and Solar seem to be spinning and shining into the grid, Natural Gas is abundant in North America, the Eagleford and the Bakken are already drilling again, and the US now allows the exporting of Crude Oil and Natural Gas. Coal is still abundant but not environmentally preferred and there is no shortage of Uranium apparently. More Nuclear power plants in China and India as well as other locations are coming on stream every year. What does it all mean?
At this point, the world seems to have eight abundant sources of low cost energy, with three prominent cost efficient sources in wind, solar and tidal added to the conventional five; Oil, Natural Gas, Nuclear, Hydro, and Coal. How it all settles out does not seem obvious. Long term investors in every area have been handsomely rewarded, then mutilated in the last 10 years. 2016 was an up year for some of the energy trades, but the energy trades lagged the basic materials trades substantially.
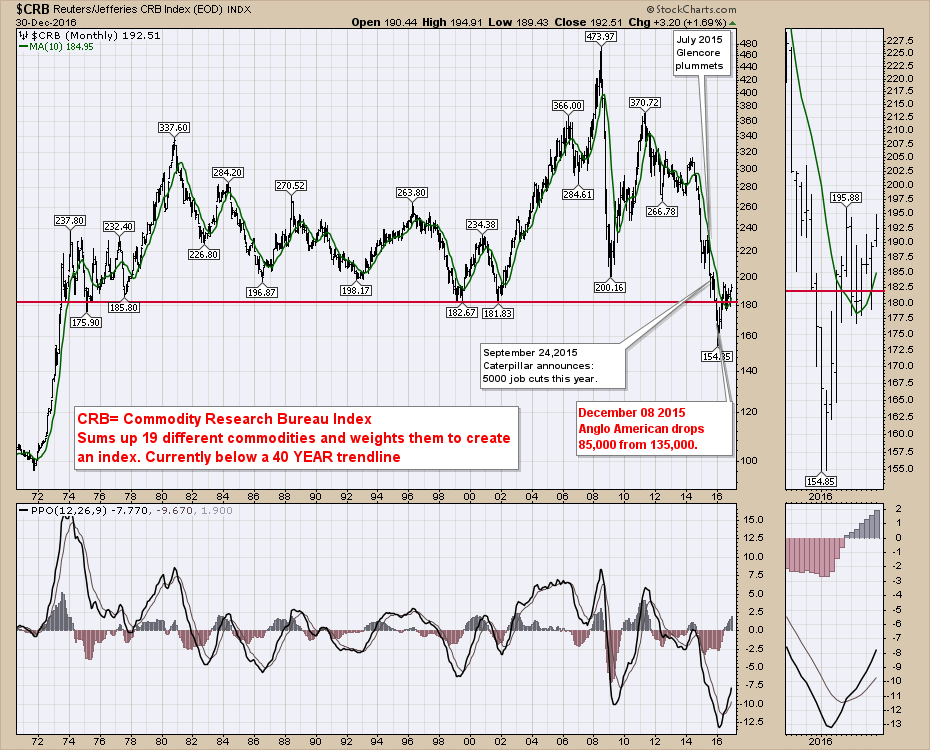
The question I keep asking is: Why are Commodities at lower price levels as a group than they have been in the last 45 years? This is an important question. Has something fundamentally changed? For that we'll need to keep watching. If this is a five wave move for commodities, perhaps this is just wave 4 and we have one more multi-year flush below. For reference, oil was at $12 in 2000. The current low on the $CRB was made when oil bottomed around $26. Oil makes up 23% of the $CRB. Hard to trade a Kondratiev cycle, but I think being aware of the cyclical nature might help us stay on the right side of the trade. You can see in the zoom box on the right, that the December close was the same as the June close. From 1980 to 2002, commodities continued to make lower highs. We could bounce up to the 220- 240 range and still not violate the downtrend.
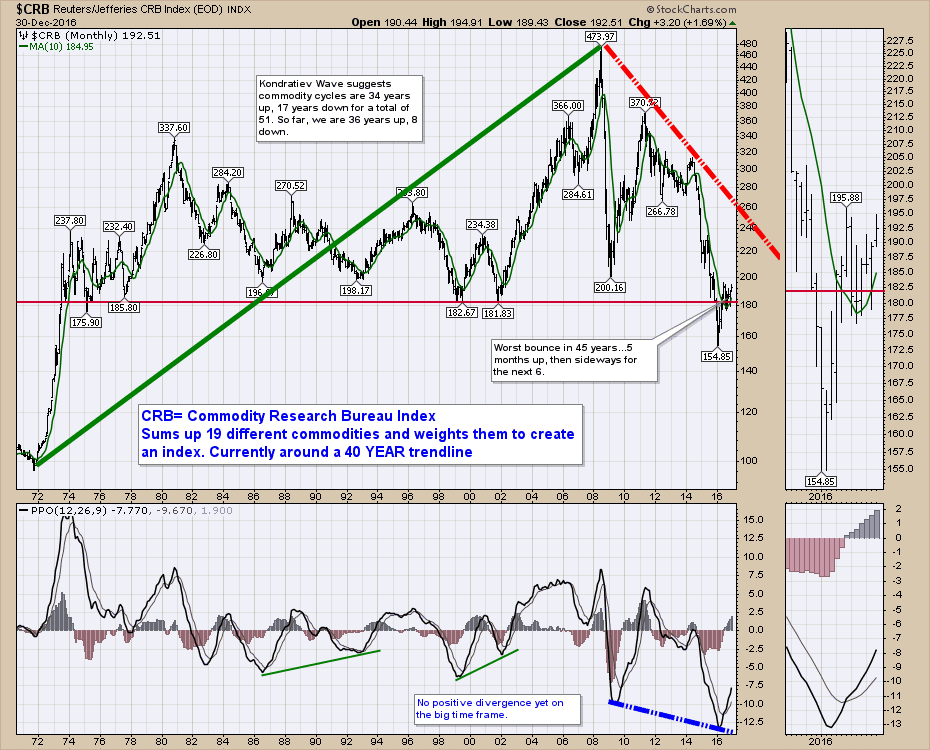 Regardless of how bullish we want to be, we still have lower highs and lower lows since 2008. Until that secular trend changes, investors should be wary of the wild swings in the commodities market. For now, the $CRB is above the 10 month MA as shown in green. It was below it as recently as last month (November).
My notes for my Traders Journal: Bombed out sectors can really rally hard. When there is blood in the streets, it might be time to revisit the area. The bearish news should be a flag to watch the industry, not invest. Price action has to confirm the suspicion. Stay tuned for big opportunities showing up again in 2017.
Commodities: Bullish until proven otherwise.
The $USD made it's final bottom in 2011 and finished 2016 near 12 year highs. That coincides with the latest top in the Commodities market. In 2014, the $USD broke above a big 10 year downtrend. The Commodities accelerated lower in 2014. Until the $USD tops out, Commodites will have a hard time being in a long term secular bull. The next article will discuss the Currencies.
Greg Schnell features Commodities every week on the Commodities Countdown blog and webinar series. If you would like to stay tuned into Commodities and some of his thoughts on the macro concepts for the equities, currencies and bonds, please join him. You can subscribe at the bottom of his Commodities Countdown blog. You can register for the webinar on the home page of StockCharts each week. Greg also keeps changing a small chartlist that has some important charts for Commodity investors. You can access that here all year long.
StockCharts members enjoy unique privileges. Access to the members only work by John Murphy (4 Books), Martin Pring(20 Books), Arthur Hill (1 Book), Tom Bowley and Erin Heim authors starts for basic members. Tom and Erin have some free content as well. StockCharts.com won an industry award in 2016 for the Best Technical Analysis Commentary Team. It is the lowest priced subscription to the best commentary team on the web. Our 'Basic' membership gets you access! Check out pricing at $155 annually.
If you hired an assistant to help you be aware of all of the new signals in the market, they would compile spreadsheets and major trends on your behalf and put them on your desk. StockCharts.com goes above and beyond that for only $95.00 a year. Twice a week, Erin Heim gives a "news broadcast" style webinar on signals through the Decision Point methodology and she publishes four new reports every day. The reports are a fantastic compilation for you, rather than hiring a full time assistant. This is included with your 'extra' membership to StockCharts.com. At $249.00, that is less than a dollar per trading day (253 days last year). It is only $0.40 a day more than a basic membership with four fantastic reports every day as well as a weekly report. Hard to hire staff for $0.40 a day. Crazy good value! Decision Point Reports.
Why become a Pro member at StockCharts? You can have up to 10 Price panels on one chart, so you can watch all the major market clues in one place. You get 5 second automatic chart refreshes at this level. You can have 50 technical alerts at any one time, that notify you about any condition on any stock you want. StockCharts will text it to you, email it or flash it on your screen. You can look back in time, 50 years or more in some cases to see historical examples of extremes. This is very helpful in understanding stretched markets up or down. A good example is the $CRB chart shown above. For less than $50/month, you can have 350 chartlists, alerts, custom scans, Decision Point reports as well as all of the commentary and webinars. Look inside our pricing module today.
StockCharts finished the year with more members than ever before. Thousands of market watchers find huge value in StockCharts.com every day. Kick off 2017 with a package that is right for you!
Good trading,
Greg Schnell, CMT, MFTA.
