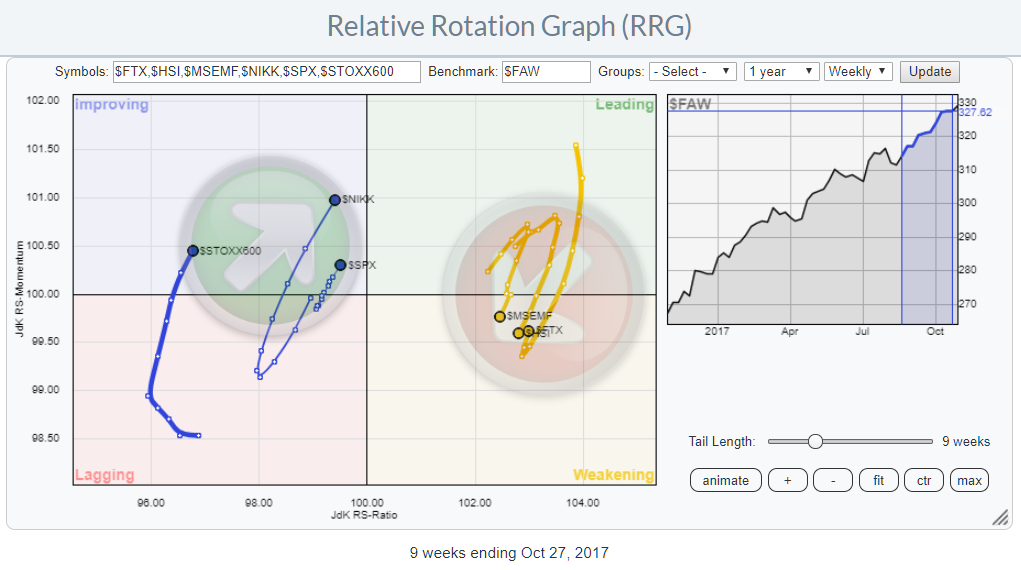
 The Relative Rotation Graph above plots a number of world equity markets against the FTSE all-world index and shows their relative rotation around this benchmark.
With all the chatter going around on the S&P 50o index camping in the nose-bleed area this gives a refreshing angle to look at the current state of world-affairs (at a stock market level that is ..).
The markets on the right, inside the weakening quadrant, are Hong Kong ($HSI), Emerging Markets ($MSEMF), and China ($FTX). If you click on the chart and open the live version you can scroll back through time and see how these markets started to improve over the US, Japan, and Europe, one by one starting in April.
Despite a 23% rally for China and 18% for Hong Kong over the past 30 weeks, everybody is talking about SPY ($SPX), up "only" 9% over the same period, being overstretched...
The RRG above shows that, from a relative point of view, the US, Japan, and Europe are far from overstretched. They started improving over their more emerging counterparts recently and especially the Japanese Nikkei index and the S&P 500 are rapidly heading towards the leading quadrant and likely to take over the leading role in world equity markets.
The Relative Rotation Graph above is, therefore, a chart that should not be ignored.
Please note that I am using the underlying index ticker symbols ($....) on the RRG and NOT the ETFs representing those markets. Read this old blog post related to this issue explaining how ETFs and their underlying indices can be completely different animals...
If you like to receive a notification anytime, a new article is posted in the dedicated RRG blog, please click "Subscribe" and leave your E-mail address.
Julius de Kempenaer | RRG Research
RRG, Relative Rotation Graphs, JdK RS-Ratio, and JdK RS-Momentum are registered TradeMarks by RRG Research
Follow RRG Research on social media:
If you want to discuss RRG with me on SCAN, please use my handle Julius_RRG so that I will get a notification
