Infosys (INFY) Is breaking out to new highs this week. Last week it closed in new high territory even while the overall market was pulling back. Nice to see the relative strength. Now it is continuing to power higher as the overall market seems to be trying to rally into earnings. The SCTR at 96 suggests a very strong stock. The full stochastics indicator is high because the stock is at a new all time high. That doesn't mean it needs to be sold. With no overhead resistance, this stock could continue to run. 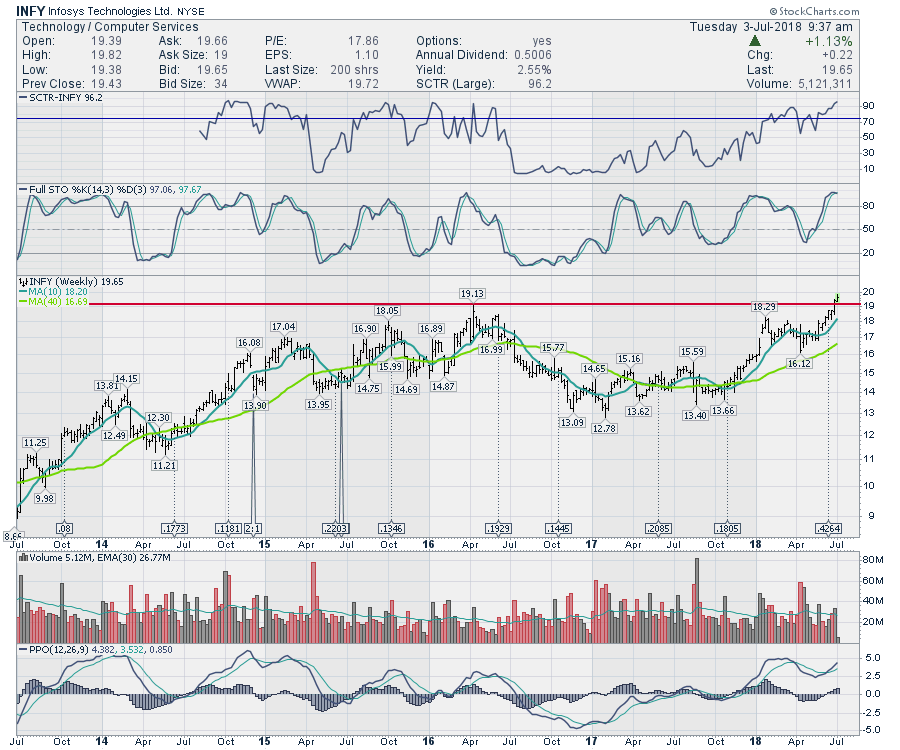
I produced another edition of The Final Bar this week. I laid out the case why I am very concerned about the global market situation. While I expect some sort of rally through earnings, it wouldn't surprise me if it runs out of gas around month end. A quick 1/2 hour! It airs Thursdays at 5 PM ET and is repeated throughout the week on StockCharts TV. You'll find the short cut to the video below. You can also catch it on my Vimeo channel or on the StockCharts.com YouTube Channel.
Here is the half year review edition of the Commodity Countdown. I focus in on the setup in Gold and silver. Remember, commodities should be bought near their lows! The Nasdaq and the Toronto Stock Exchange both failed to hold their breakouts to new highs so this week is important. The Bullish Percent indexes are particularly precarious.
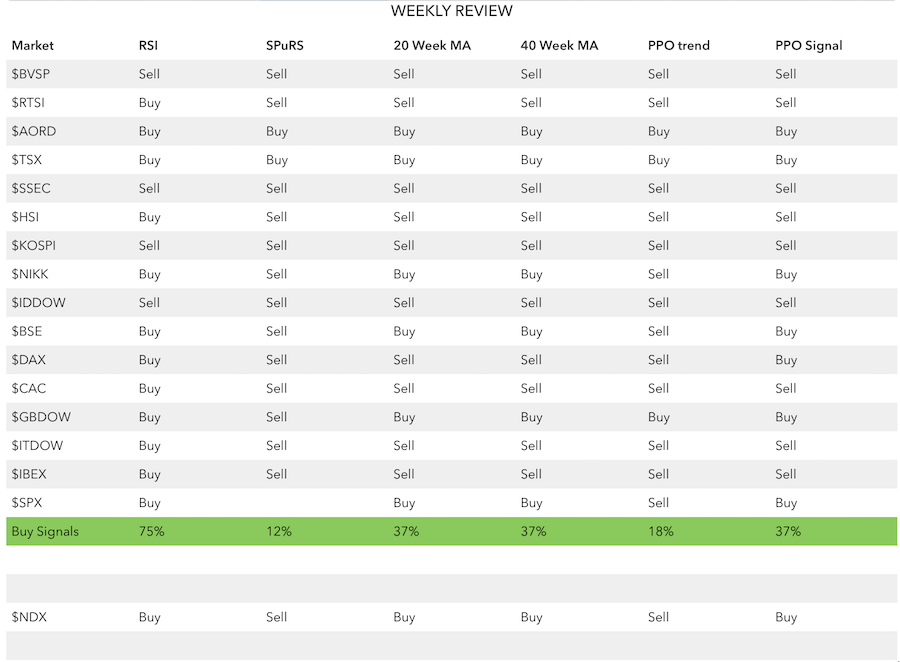
Here is a screen shot of 16 different indexes and where they are in terms of a buy or sell right now. My favorite is the PPO trend as it is one of the earliest, but even the PPO signal suggests trouble ahead. The RSI below 40 is the slowest signal. The percentage below shows how many indexes are still on a buy signal depending on your indicator. SPuRS is the relative strength compared to the $SPX. The bottom line: most markets are on a sell signal. More on the video. Makes the video pretty important!
For Canadian investors, here is a copy of the most recent Canadian Technician video. Canada suffered a failed breakout this week and I'll review that on Tuesday's fresh new update.
If you are missing clues on signals in the market, follow me on Twitter and check out my Vimeo Channel often. Bookmark it for easy access!
Good trading,
Greg Schnell, CMT, MFTA
Senior Technical Analyst, StockCharts.com
Book: Stock Charts for Dummies
Twitter: Follow @Schnellinvestor


