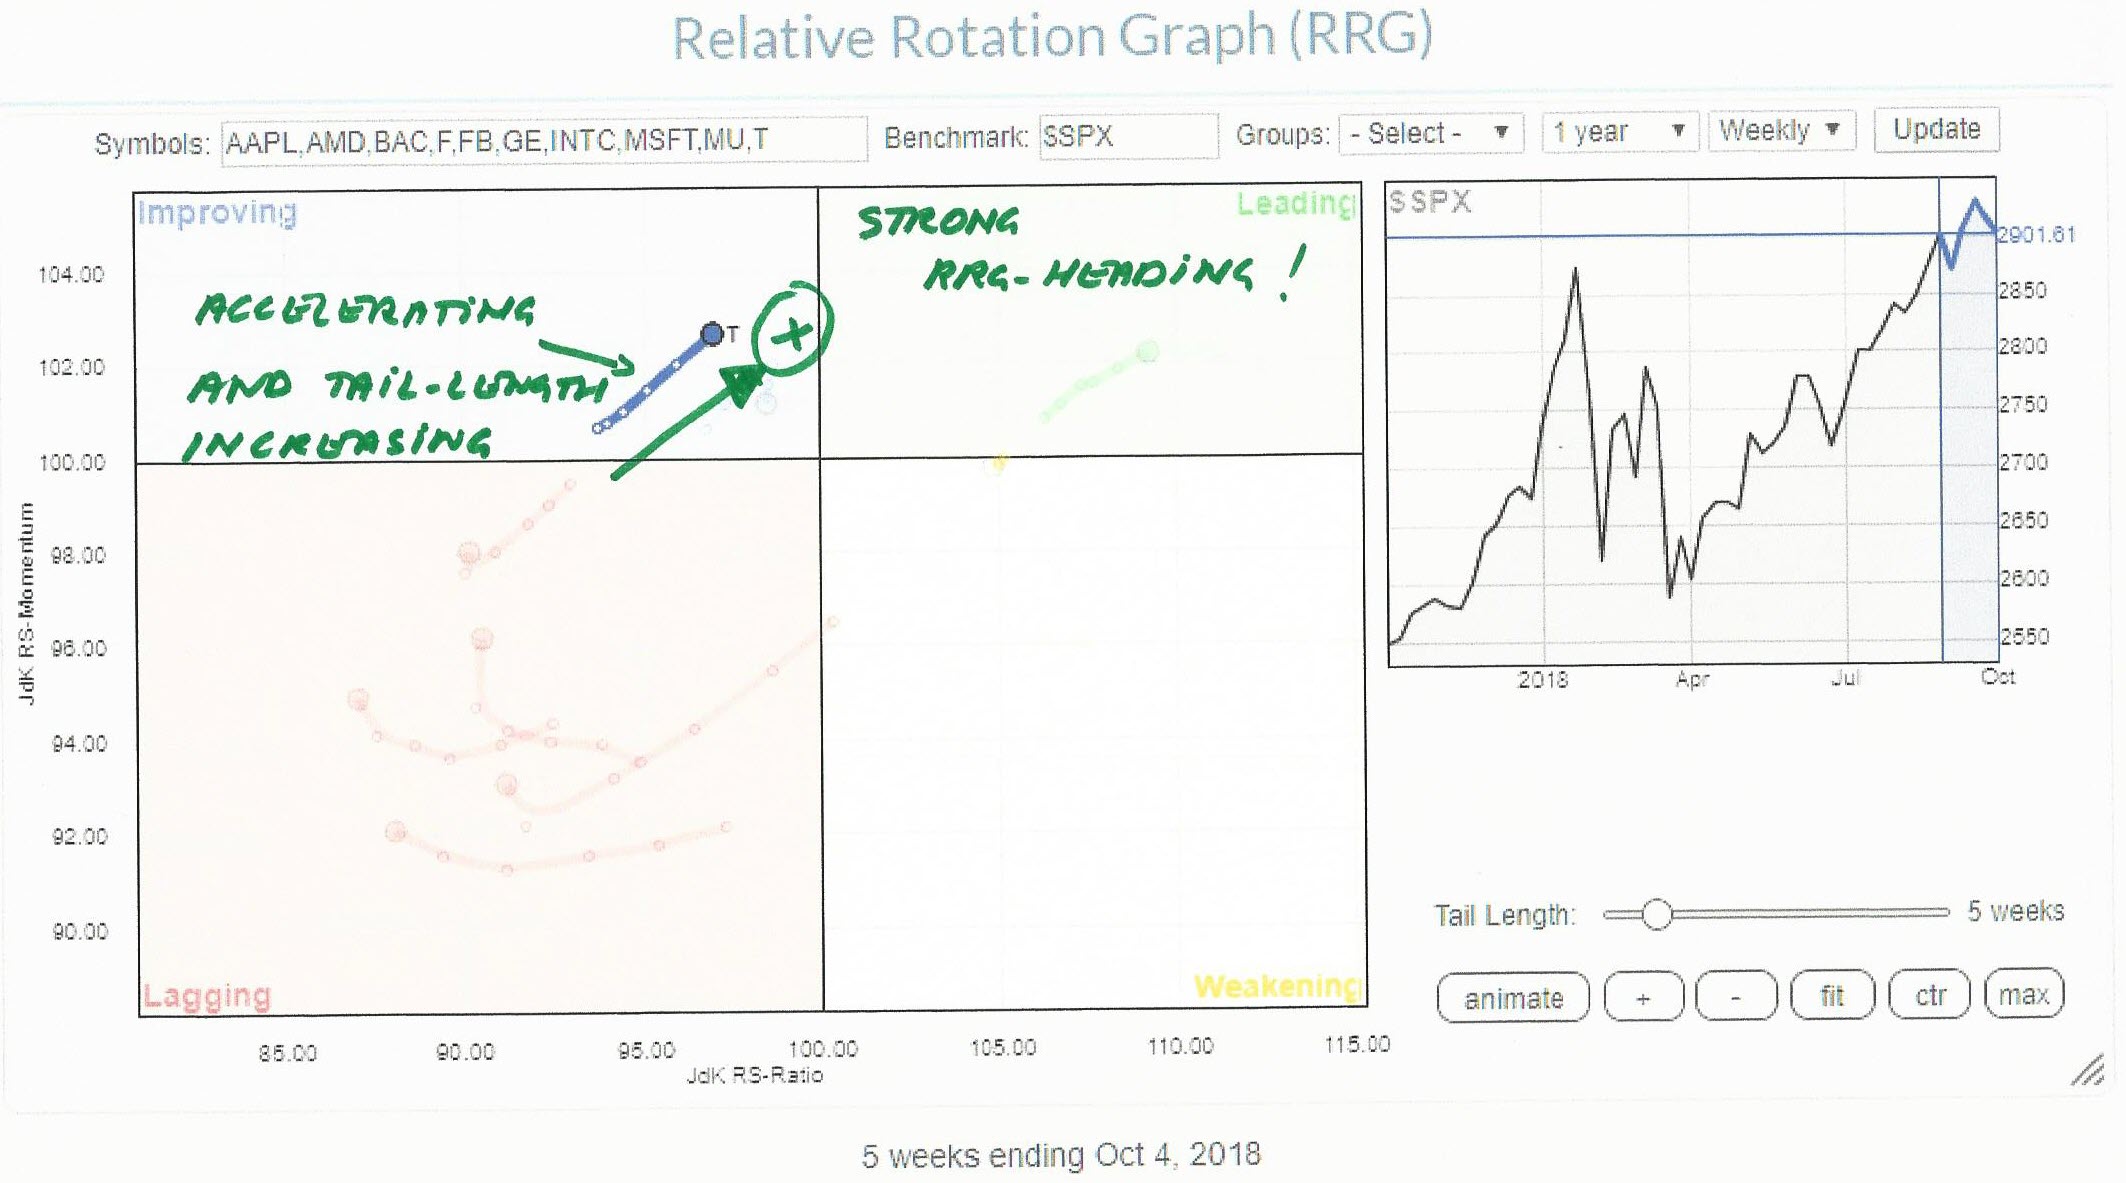
 After yesterday's close (10/4) I ran a Relative Rotation Graph of the Top-10 Market Movers inside the S&P-500 index.
One of the names that popped up as potentially interesting was AT&T (T) as it is inside the improving quadrant and moving towards the leading quadrant at a strong RRG-Heading.
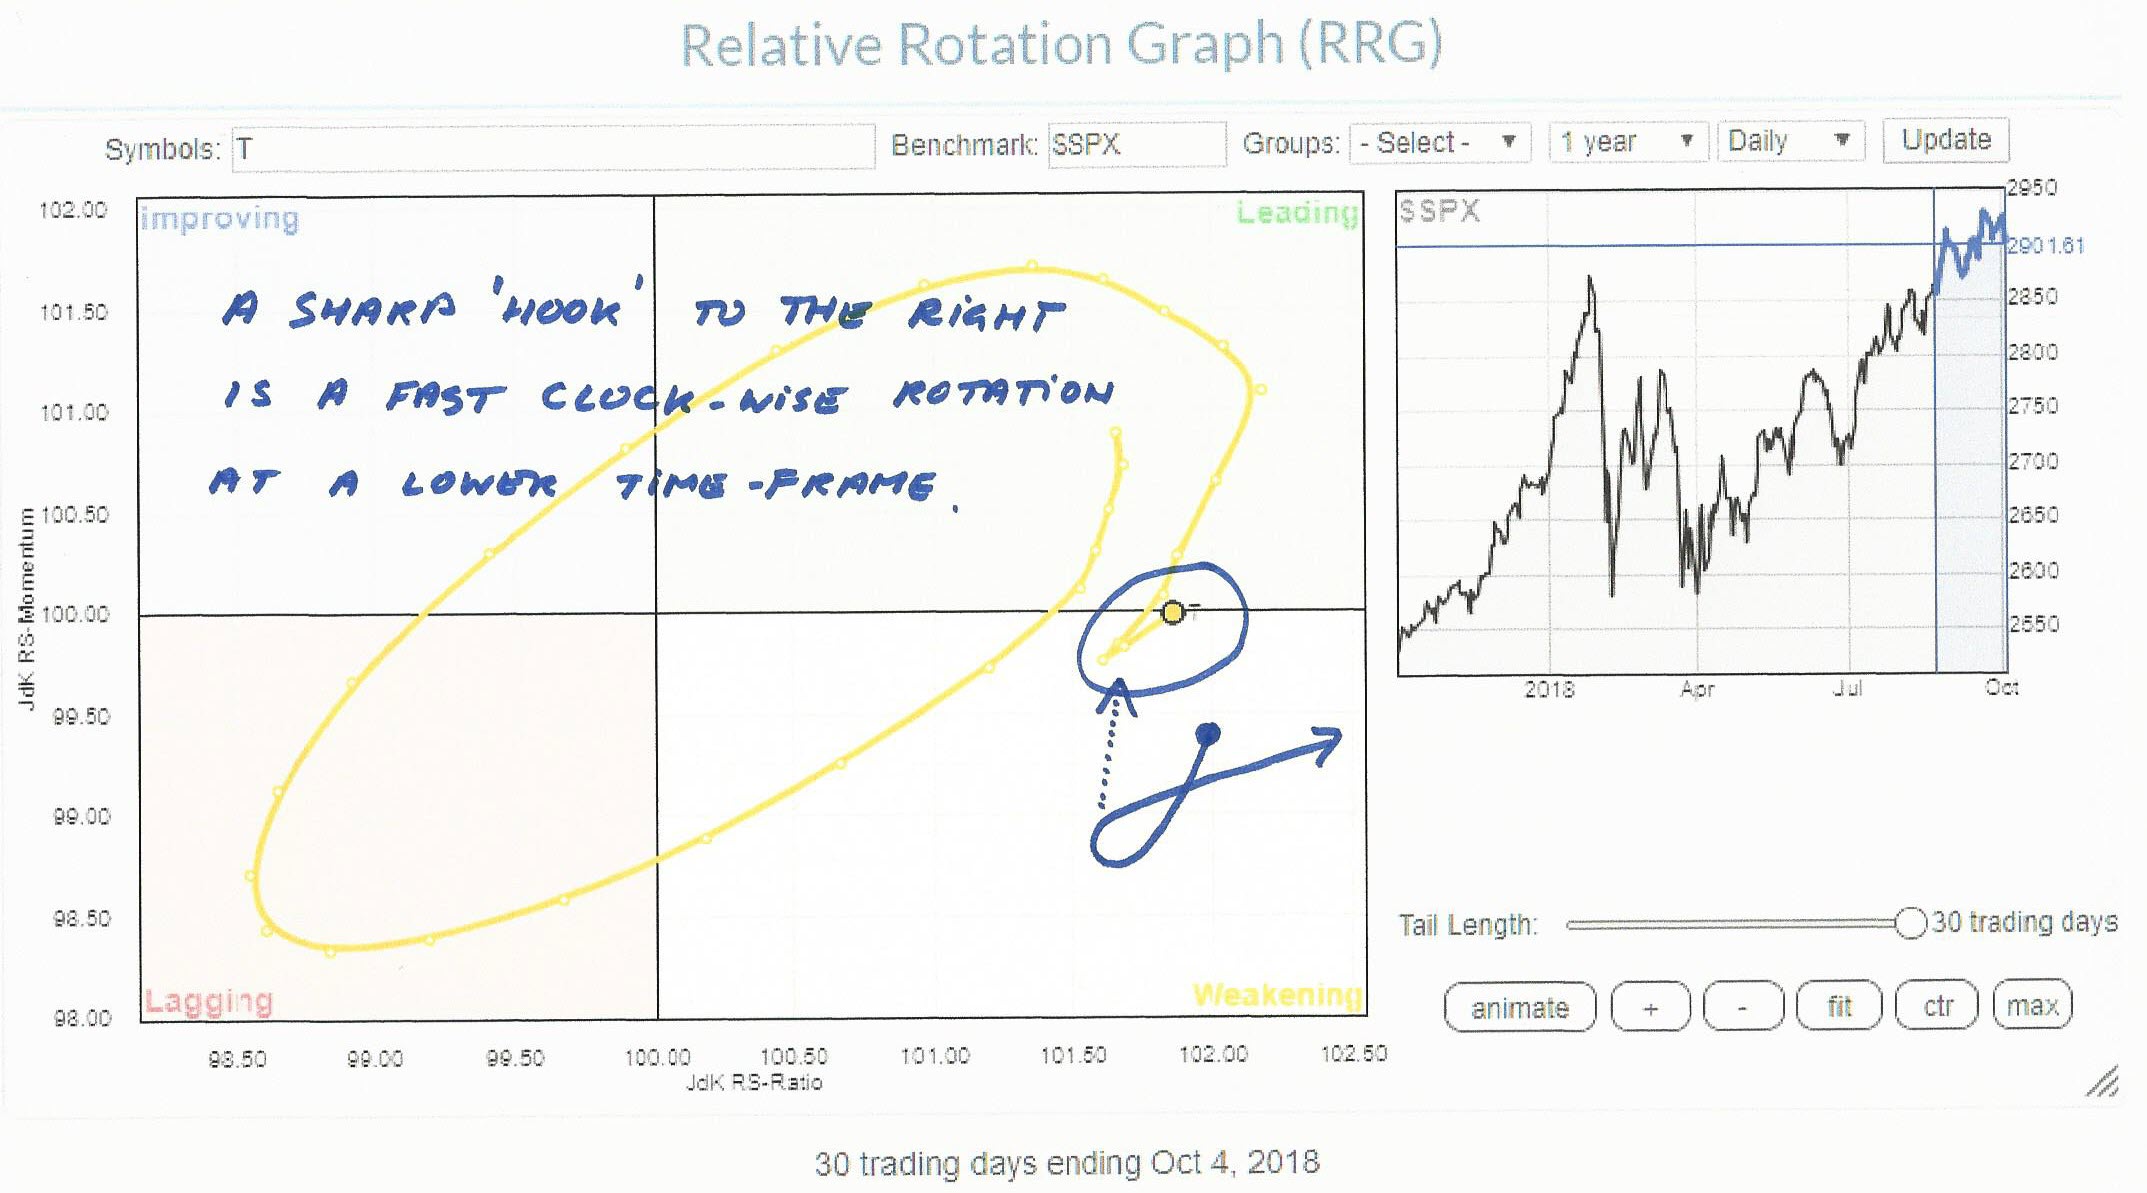
The Daily version of that RRG (above) shows the strong rotation of T over the last 30 trading days which recently rolled over inside the leading quadrant and crossed over into weakening before "hooking" back up and moving (almost) back into leading.
The drawn "curl" shows the rotation that took place at a lower time-frame (hourly for example) but which occurred so fast that it does not show up on the daily RRG as a proper rotation.
This rotation that now seems to be completing the rotation at the right-hand side of the RRG, confirming the positive move that is seen on the weekly RRG (below)
 The price chart, in combination with relative strength, reveals that AT&T broke out of a downtrend in the middle of August. After an initial rally that peaked near $ 33 the pullback came to a rest at the level of the former resistance line and started the second leg of the up-move. In the second half of September T broke above its previous low and turned the trend around.
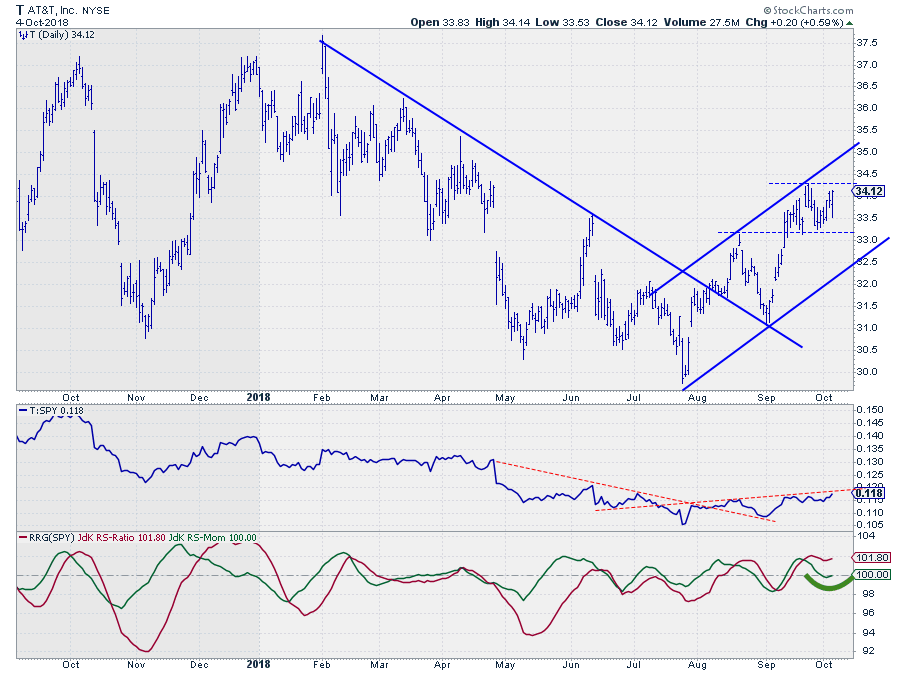 From a relative perspective, the raw-RS line is bottoming out and about to start a fresh series of higher highs and higher lows which pushes the stock further into the leading quadrant.
AT&T looks interesting with (intermediate) support levels at $ 32,50 and $ 33, while a break beyond the recent high confirms the positive outlook.
My regular blog is the RRG blog If you would like to receive a notification when a new article is published there, simply "Subscribe" with your email address using the form below.
Julius de Kempenaer | RRG Research
RRG, Relative Rotation Graphs, JdK RS-Ratio, and JdK RS-Momentum are registered TradeMarks ®; of RRG Research
Follow RRG Research on social media:
Feedback, comments or questions are welcome at Juliusdk@stockcharts.com. I cannot promise to respond to each and every message but I will certainly read them and where reasonably possible use the feedback and comments or answer questions.
If you want to discuss RRG with me on SCAN, please use my handle Julius_RRG so that I will get a notification.
