 One of the names that popped up today on my alert for potential "Turtle Soup" setups is KIM. After opening up the chart for further inspection I noticed an interesting situation.
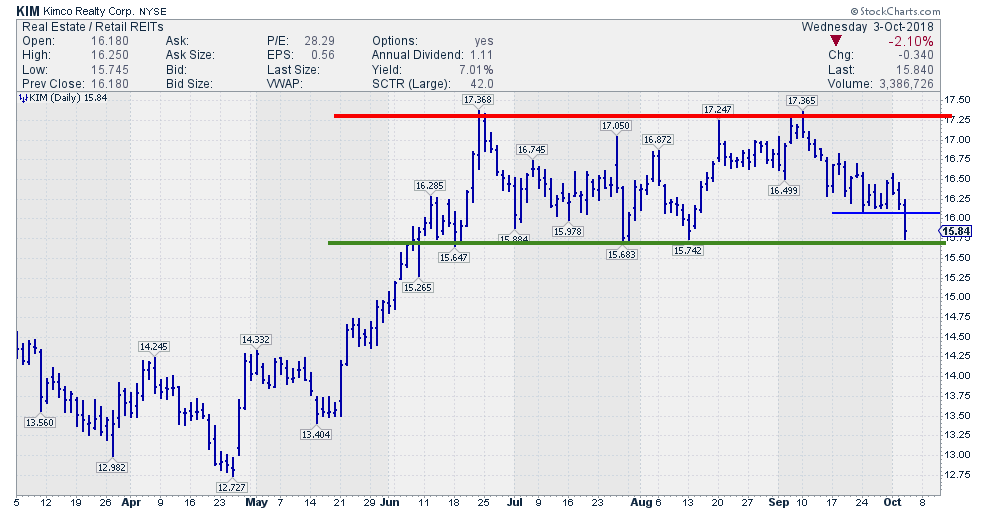
It is very clear that the stock is in a trading range since June. The upper boundary around $ 17.25 has been tested a few times and so has the lower boundary that shows up near $ 15.50. With yesterday's low at $ 15.74, KIM is testing that lower boundary again at the moment.
What makes the chart interesting is the fact that the trigger for a TS(+1) buy for today is a few ticks above $ 16.09 which is the low of 9/24.
Resuming the rules for the setup. Today must make a new 20-day low (that happened yesterday) and the previous 20-day low must be at least four days prior (that was$ 16.09 on 9/24). The buy signal is triggered when either on the day of the new low (that was yesterday) or the day after, that is TODAY, the price rises back above that previous 20-day low (+ a few ticks). Let's peg that "few ticks" at $ 16.20 and watch if today 10/4 KIM will be able to rally above $ 16.20 and continue that move.
If that happens we'll have a test of the lower boundary of the range in combination with a TS buy-trigger. That combination definitely looks like a tradable opportunity.
Remember: Initial stop goes just below YESTERDAY's low ($15.74) and should be trailed higher as the position becomes profitable.
My regular blog is the RRG blog If you would like to receive a notification when a new article is published there, simply "Subscribe" with your email address using the form below.
Julius de Kempenaer | RRG Research
RRG, Relative Rotation Graphs, JdK RS-Ratio, and JdK RS-Momentum are registered TradeMarks ®; of RRG Research
Follow RRG Research on social media:
Feedback, comments or questions are welcome at Juliusdk@stockcharts.com. I cannot promise to respond to each and every message but I will certainly read them and where reasonably possible use the feedback and comments or answer questions.
If you want to discuss RRG with me on SCAN, please use my handle Julius_RRG so that I will get a notification.


