 When markets around the world start to rumble it's usually a good exercise how all these moves compare against one another.
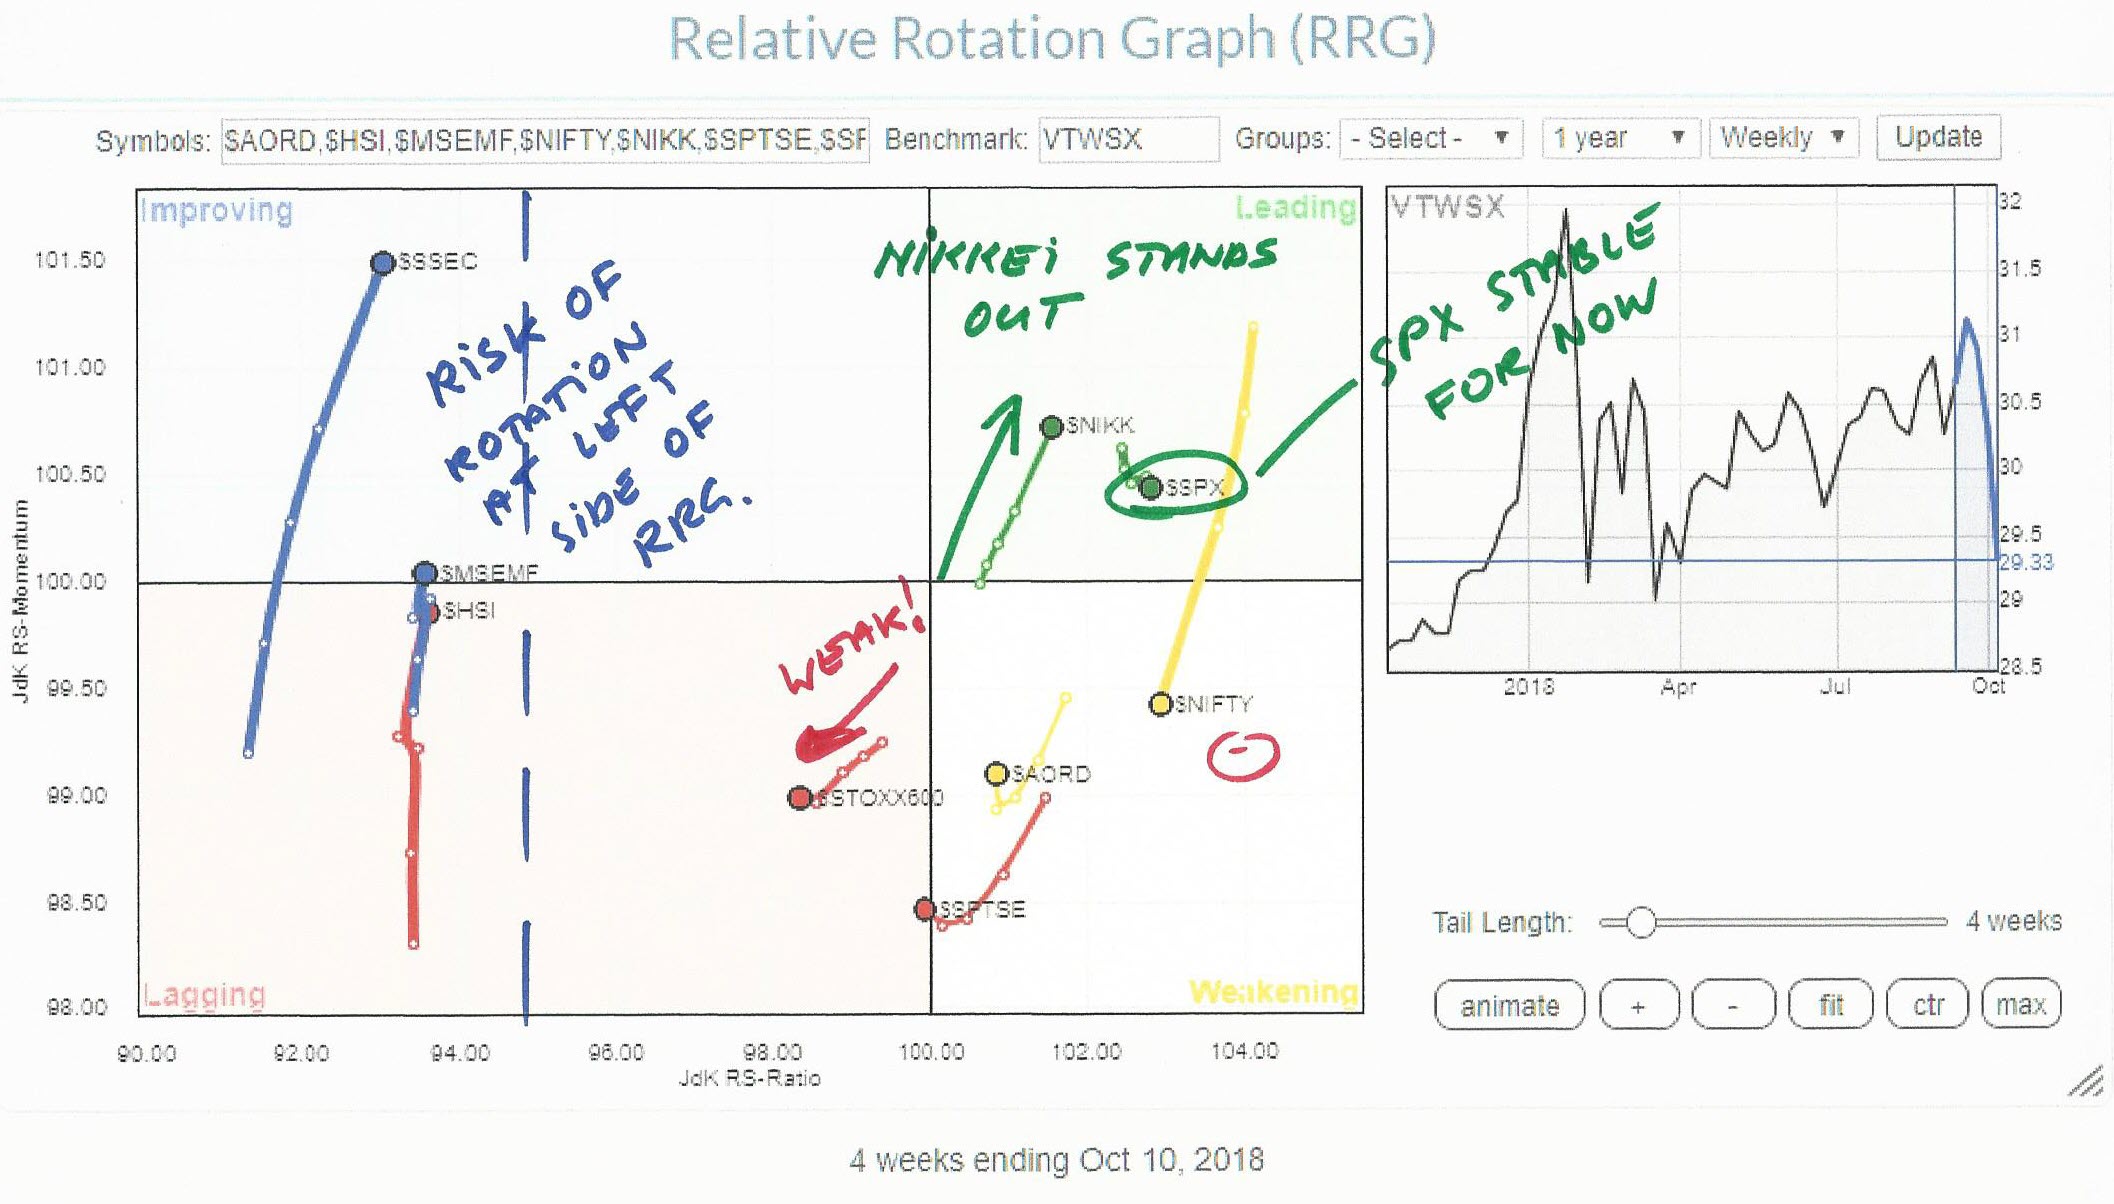
The Relative Rotation Graph shows the relative picture for a number of major world equity markets against the Dow Jones World Index as the benchmark.
The Indian $NIFTY index is on its way down backed by a long tail that is sending it lower on both axes well inside the weakening quadrant. A similar rotation, albeit with less strength, is visible for the Canadian.
The weakest rotation is found for the European $STOXX600 index that just crossed over into the lagging quadrant.
On the edge of the lagging and the improving quadrant are Emerging Markets and Hong Kong while the Shanghai composite is well underway inside the improving quadrant. The problem with these three markets is that they are still far away to the left (=negative relative trend) of this RRG which makes them vulnerable for a complete rotational pattern at the left-hand side.
The US market is still inside leading AND showing a short tail which means a stable position, we will have to monitor things going forward but for the time being other markets around the world a dropping faster than the US.
The ONE market that stands out is the Japanese Nikkei index ($NIKK). This market is traveling into the leading quadrant at a strong RRG-Heading while week-to-week observations have been increasing lately, indicating positive power.
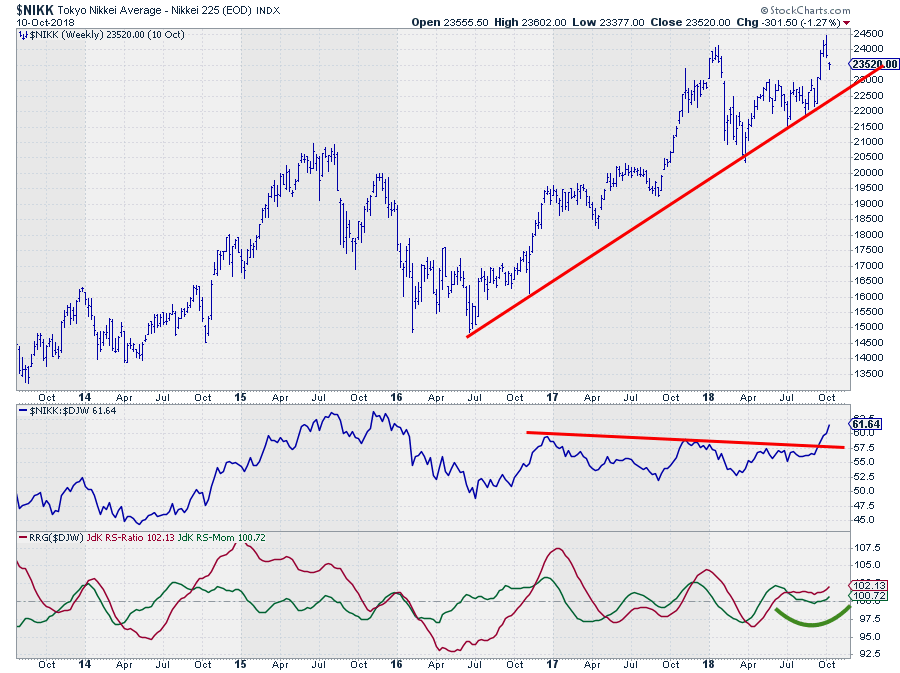 The price chart of the Nikkei Index in combination with relative strength against the Dow Jones World index shows that price is still above rising support. Even with the sharp decline today, which is not yet shown in the chart above, the Nikkei at 22.590 remained above support.
From a relative point of view things look pretty strong, the raw RS-Line broke above overhead resistance offered by the last three highs and followed through strong. The RRG-Lines are both above 100 and the "touch and go" move of the JdK RS-Momentum line at 100 indicates that the first relative pull-back has already completed and both can now continue to move higher against the world.
Don't Ignore the Japanese market!
My regular blog is the RRG blog If you would like to receive a notification when a new article is published there, simply "Subscribe" with your email address using the form below.
Julius de Kempenaer | RRG Research
RRG, Relative Rotation Graphs, JdK RS-Ratio, and JdK RS-Momentum are registered TradeMarks ®; of RRG Research
Follow RRG Research on social media:
Feedback, comments or questions are welcome at Juliusdk@stockcharts.com. I cannot promise to respond to each and every message but I will certainly read them and where reasonably possible use the feedback and comments or answer questions.
If you want to discuss RRG with me on SCAN, please use my handle Julius_RRG so that I will get a notification.


