Well, what's it going to be - up or down? The market made its high on Options Expiration Friday and has been unable to take out that high for 6 days. With AAPL trading up in after hours and other tech names to report this week, will we be able to push through that high?
The market is very sticky here. For technicians, the bright light we see ahead is a freight train loaded with resistance on daily and weekly charts. Fundamental investors, meanwhile, continue to see earnings downgrades. We have not had heavy volume on the selling days. However, the pressure got to me as I lightened up my trades following the second 400-point down move on the Dow Jones Industrial Average in under a week. I used the Dow as a reference point, but the chart below is of the larger $SPX. We've had two days gap up on the open and trade throughout the day, only for them to both gapp down the following day, creating island reversals on a 60-minute chart or abandoned babies on daily charts, as Arthur Hill noted on Monday.
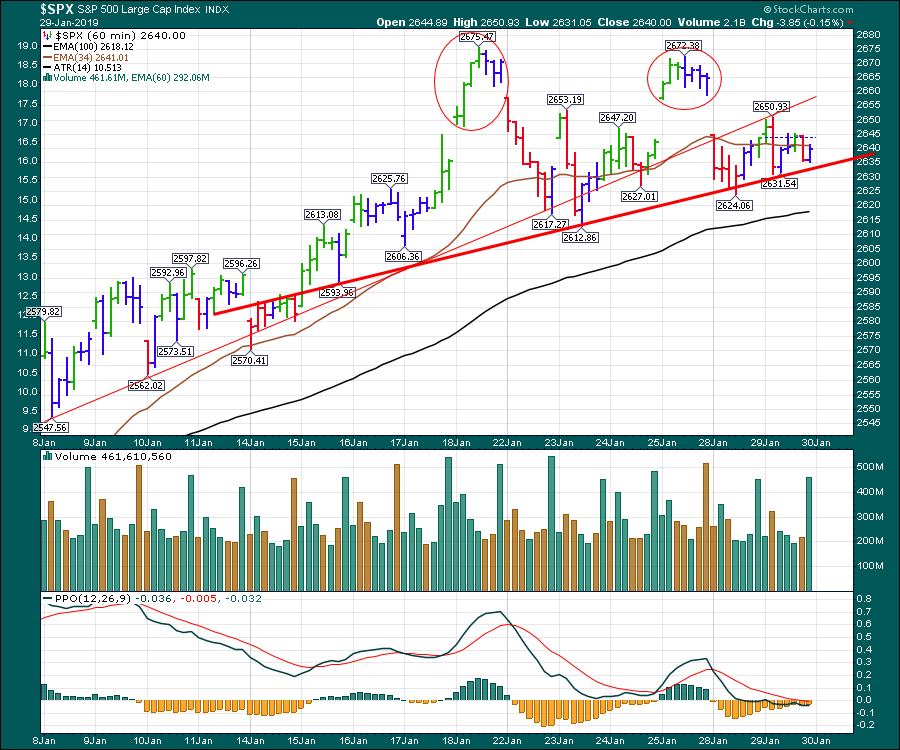 Notice how the PPO 60-minute momentum is sitting at zero and is flat heading into the Fed meeting on Wednesday. We also have lower lows and lower highs in momentum, which is concerning at these levels.
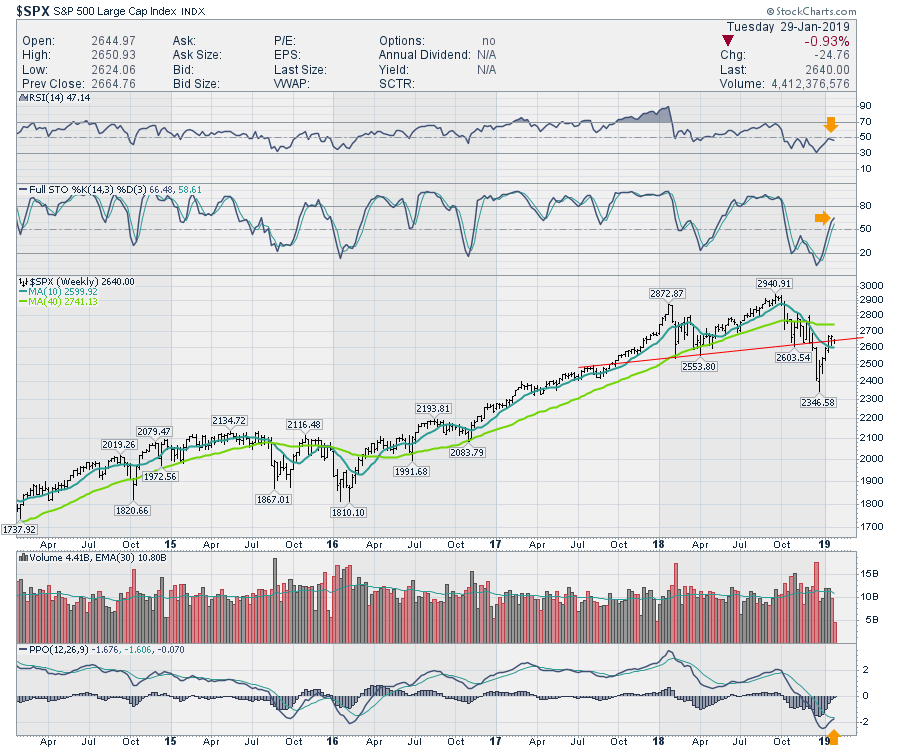
I think the weekly chart below is the much more important chart. Seeing the market stalling here is making me very cautious. The RSI touching 30 on a weekly chart is particularly important as this usually marks a new bear market. Looking left, we can see this same indicator reading in 2015. After a rally where the RSI got to the mid fifties, it rolled over. So far we have stalled at 50, but it is early in the week and we have three more trading days left. So the weak RSI is a strong clue that the market is very weak. We can have big rallies inside a bear market that make everyone bullish, but they lose steam and roll over. Is that what is happening now?
If the full stochastic rolls over under eighty, that is usually another signal that the market may fall faster than expected. I don't see any good examples of that looking left on this chart below. The full stochastic is one of the earlier signals on a weekly chart that gives notice sooner rather than later, as you can learn from observing thousands of charts. Rollovers under 80 on weekly charts sometimes mean the chart is about to make a move down.
The fact that price is still below the 40-week moving average also suggests we're inside a bear market - and that we're getting close to a rollover. The red trend line shows the market back-testing a trend line now. This is very common in charting. The trend line is broken and, on the subsequent rally, the market gravitates back to that level. Often it is the inflection point where the market falls from on the next move down. With last week's bar unable to make a higher high and this week starting with another big drop, there is certainly reason to be cautious. We don't usually lose 400 points twice in five days during big bull uptrends. Perhaps this is just shaking out the weak hands, but I'll admit I'm one with weak hands when it happens at these technical levels. The PPO is trying to cross the signal line, which is technically good. But the first thrust under zero can be a clue that this market is getting weak and that the next rally should be sold. The real question is, where is the top of this rally? With the bearish volatility picking up, I think that we might need to pause or even retest the lows soon. Should it move beyond simply a retest of the lows, this would be one of the better exits.
 All that is to say that the market is waving caution flags like a 24-hour Daytona race in the rain. What we don't know is if the remaining race will successfully resume or be called off. With more tech earnings, the Fed, trade disputes and politics, the market has plenty to absorb here. My suggestion is to not drive blindly in the rain. Build a plan to protect from more damage if another storm comes to pass. The setup is currently there. Caution is warranted.
Good trading,
Greg Schnell, CMT, MFTA


