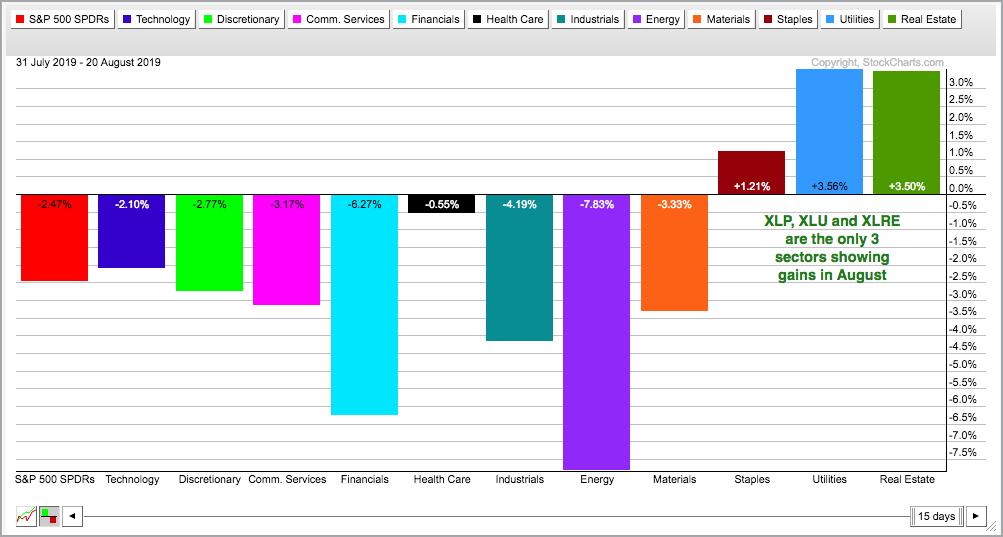
Taking a top-down approach to the stock market, we can break down the major indexes into sectors, the sectors into industry groups and the industry groups into individual stocks. There are eleven sector SPDRs and three clear leaders. The Utilities SPDR (XLU) and Real Estate SPDR (XLRE) hit new highs this week, while the Consumer Staples SPDR (XLP) came very close to its July high. Admittedly, there is some debate on classifying utilities and REITs as sectors because they are relatively small (3.24% to 3.45% of the S&P 500) and homogeneous (source: SPDRs.com).
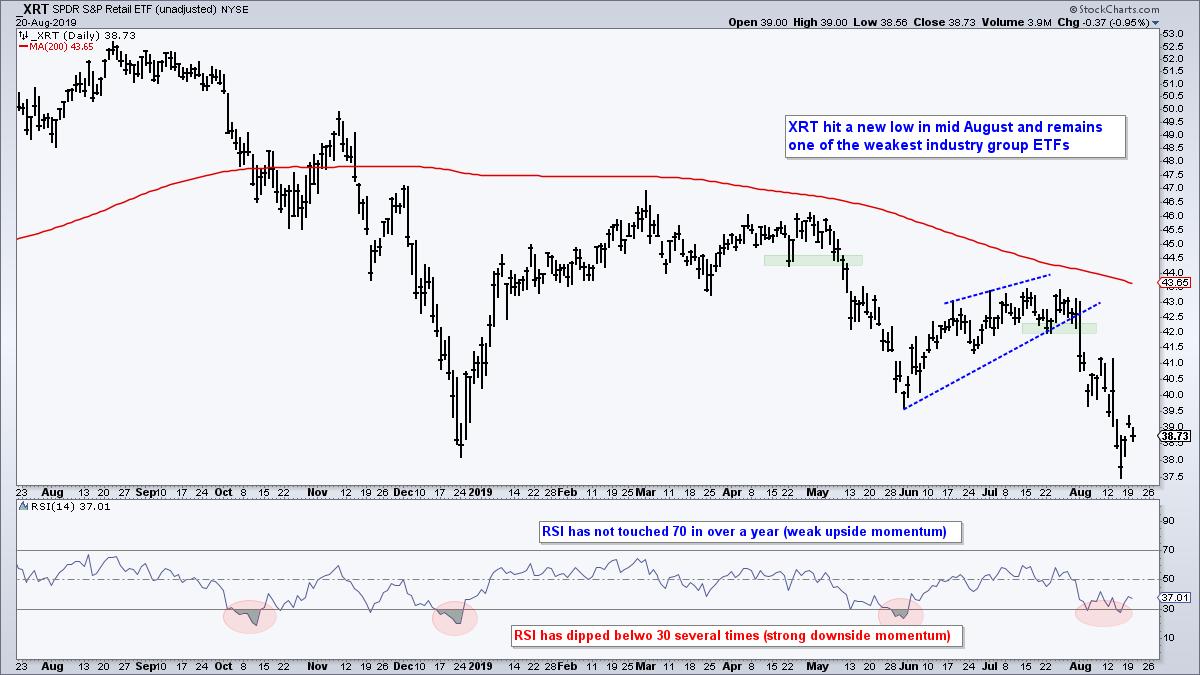
There are dozens of industry group ETFs and most fit within one of the sectors. For example, the Retail SPDR (XRT) and Home Construction iShares (ITB) fit within the Consumer Discretionary SPDR (XLY), even though Amazon is the top holding (22.5%). Somehow, Amazon does not fit the typical profile a consumer discretionary stock. Note that the company generates more than half of its revenue from retail services, but half of its profit comes from Amazon Web Services. But I digress....
Returning to the consumer discretionary sector, one would think XRT and ITB were in different sectors when looking at the price charts. The first chart shows XRT breaking down again in early August and hitting a new low in mid August. This is one of the weakest industry groups in the market right now.
The next chart shows the Home Construction iShares (ITB) hitting a new high in mid August and again on Tuesday. This is one of the strongest industry group ETFs right now. ITB held up extremely well in early August and did not come close to its July low. Moreover, the ETF is consistently recording higher highs and higher lows.
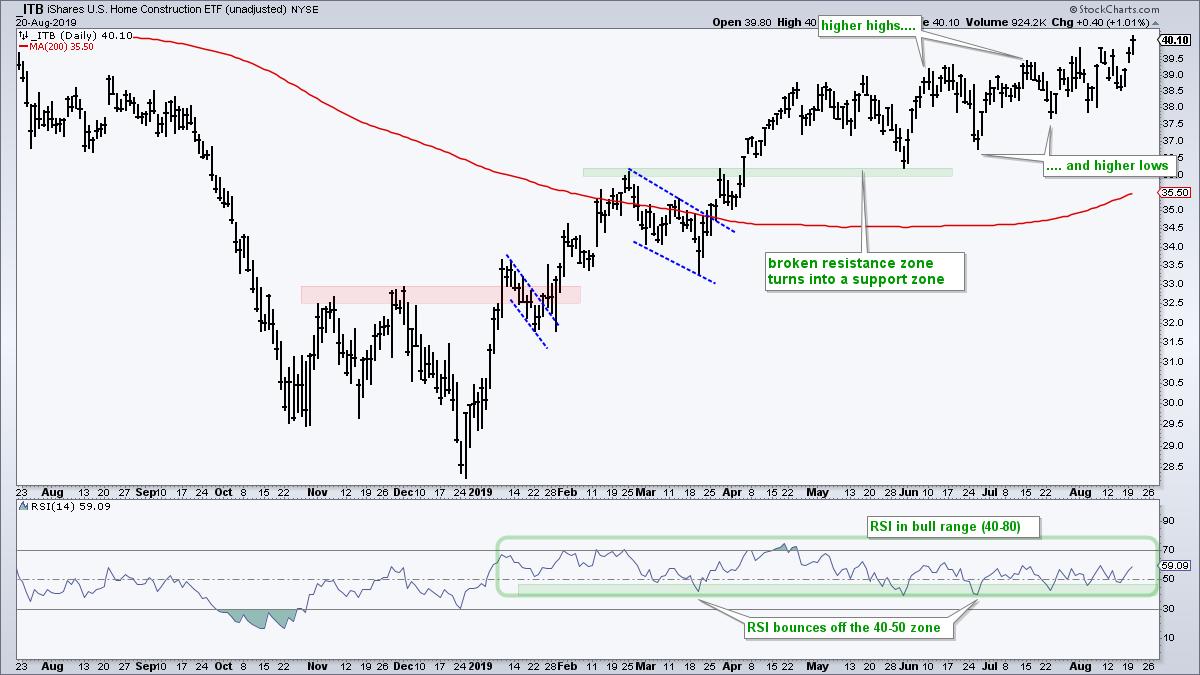
Is ITB the strongest industry group ETF right now? That is open for debate, but it is one of these strongest right now. The Mobile Payments ETF (IPAY), the Aerospace & Defense iShares (ITA) and the Solar Energy ETF (TAN) are contenders as well.
In Tuesday's commentary, I look at ways to measure risk-o and risk-off using the S&P 500 SPDR (SPY), the High Yield Bond SPDR (JNK), the 7-10 YR T-Bond ETF (IEF), the S&P 500 Low Volatility ETF (SPLV) and the S&P 500 High Beta ETF (SPHB). Read further....
------------------------------------------------------------
Choose a Strategy, Develop a Plan and Follow a Process
Arthur Hill, CMT
Chief Technical Strategist, TrendInvestorPro.com
Author, Define the Trend and Trade the Trend
Want to stay up to date with Arthur's latest market insights?
– Follow @ArthurHill on Twitter


