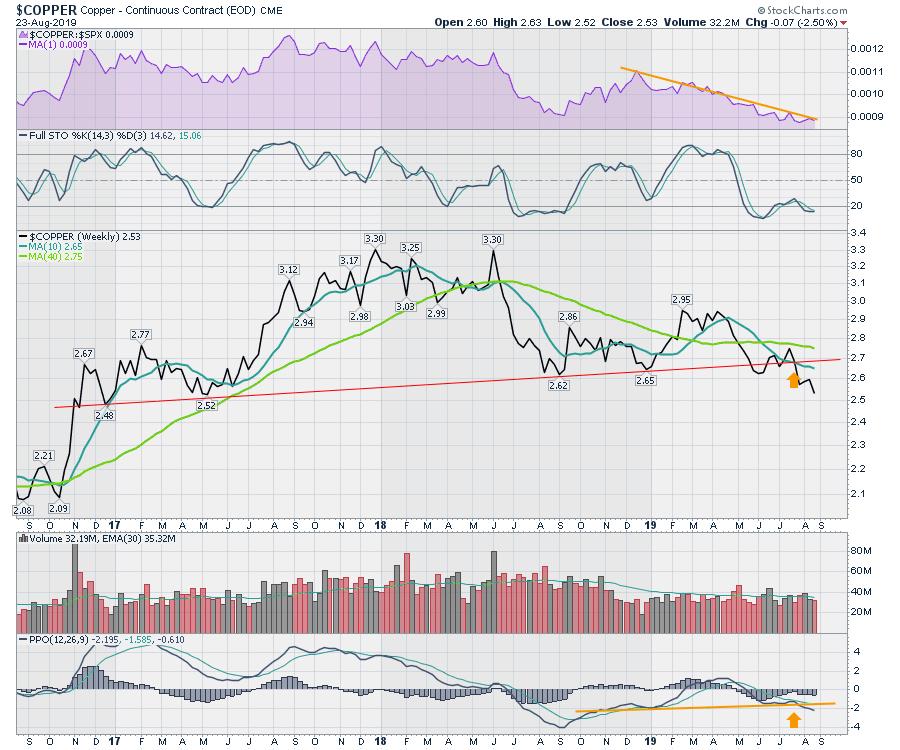
Copper continues to be an indicator of global macro trends. Like a bad movie, the plot keeps getting worse.

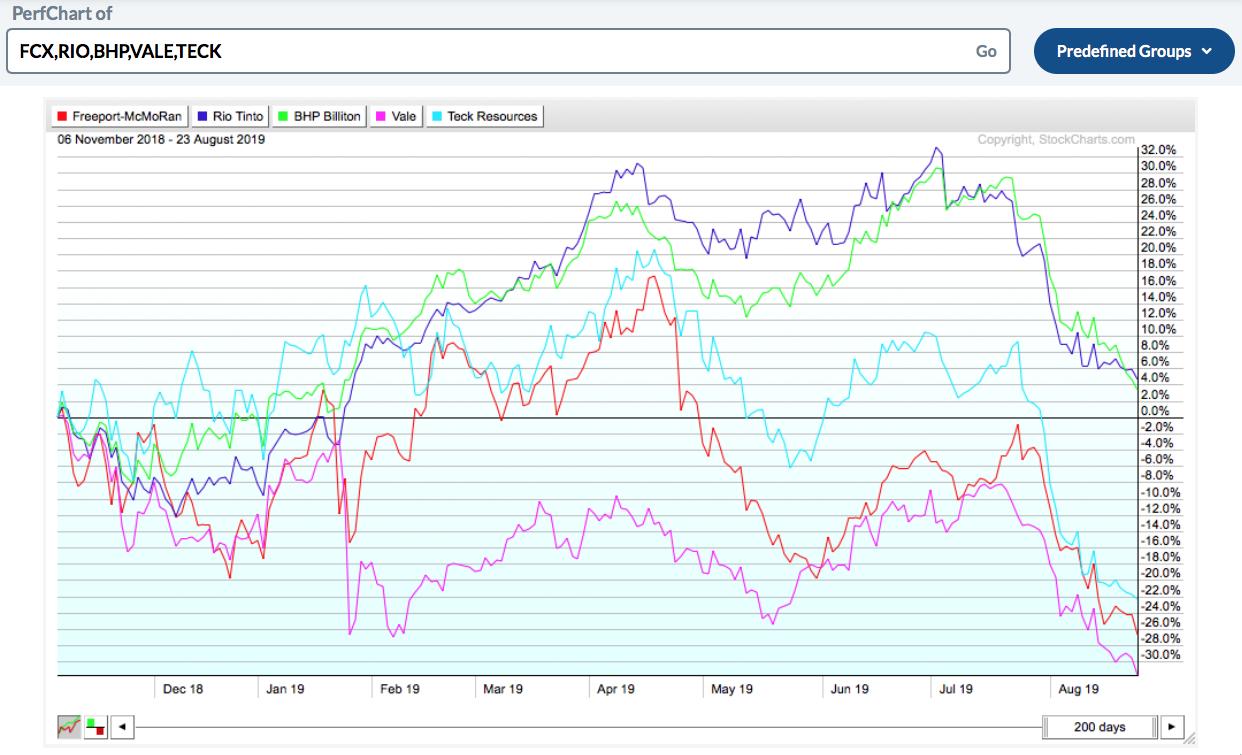
Below is a chart of the big miners going back to November 2018. There's no magic reason for selecting that date other than it was 200 days ago. Notice how the Australian companies (BHP and RIO) have dropped recently, pulling back as to be nearly unchanged, but the other three are getting taken out to the woodshed.

These charts could get a V-bottom on a trade deal, but that doesn't appear to be in the charts yet. Stay cautious on the industrial metals-related trades.
Good trading,
Greg Schnell, CMT, MFTA
Senior Technical Analyst, StockCharts.com
Author, Stock Charts For Dummies
Want to stay on top of the market's latest intermarket signals?
– Follow @SchnellInvestor on Twitter
– Connect with Greg on LinkedIn
– Subscribe to The Canadian Technician
– Email at info@gregschnell.com


