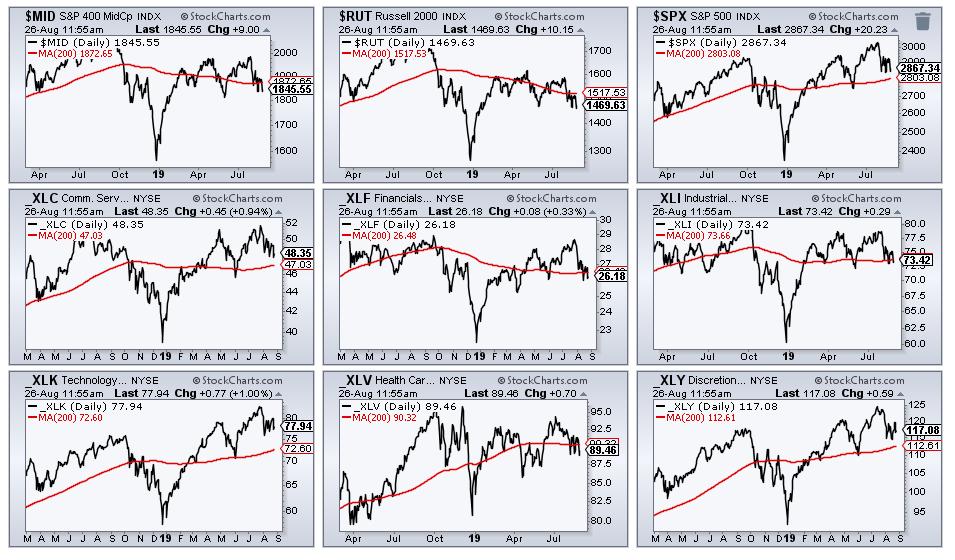
The pickings are getting slim as the broader market destabilizes. The S&P 500 and Nasdaq 100 remain above their 200-day SMAs, but the S&P Mid-Cap 400 and Russell 2000 are below these key moving averages. The Consumer Discretionary SPDR (_XLY), Communication Services SPDR (_XLC) and Consumer Discretionary SPDR (_XLY) are above their 200-day SMAs, but the Industrials SPDR (_XLI), Financials SPDR (_XLF) and Health Care SPDR (_XLV) slipped below these key moving averages. Note that I am referring to unadjusted prices for these moving average signals. Simply precede the symbol with an underscore to see unadjusted prices (e.g. _XLI).
Finding strong stocks is a challenge in such environments. Moreover, overall risk tends to rise when the broader market is unstable or bearish. Having clarified the broad market environment, I am seeing stable uptrends in a few stocks, such as Merck (MRK), HCP (HCP), Church & Dwight and Akamai (AKAM). Today I will focus on Merck.
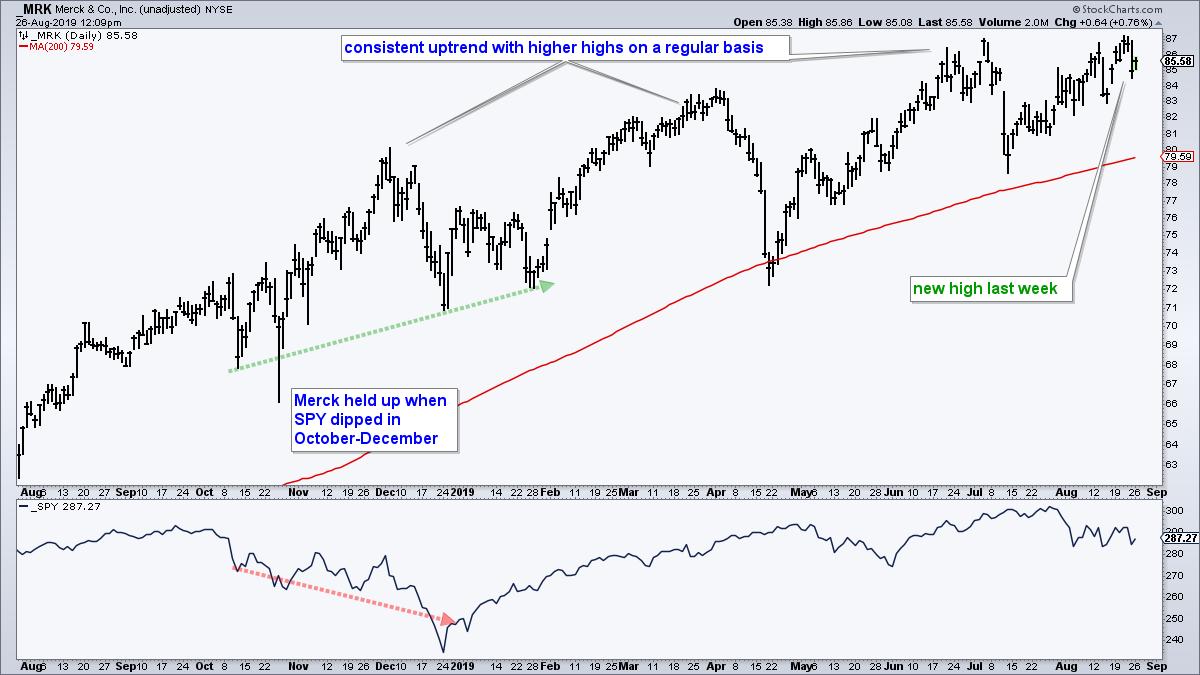
First, note that the chart above shows Merck holding up quite well in the October-December period last year. The S&P 500 SPDR (SPY) fell some 20% from high to low, but Merck managed a higher low during this period and did not break down. Second, notice how the stock forged higher highs and higher lows on a consistent basis over the past year. The most recent high occurred last week, even when the broader market fell.
Admittedly, the current environment is quite a challenge and past performance does not guarantee future performance. Merck is still part of the stock market and the Healthcare sector is not performing that great. Given the zigzag nature of this uptrend, Merck could even pullback to the lower 80s, and still be in a consistent and strong uptrend.
------------------------------------------------------------
Last Week on Art's Charts
Subscribe to Art's Chart using notification box at bottom of the commentaries.
State of the Stock Market - Meet Mr. Split - Index Breadth and Sector Breadth Model Updates, analysis for SPY and daily AD Percent, and the Bottom Line.
Technology Could Hold the Key Going Forward - Charting the leading ETF groups (bonds, defensives, gold and low volatility), as well as a list of the laggards.
Measuring Risk On/Off with Stocks, Treasuries, Junk Bonds, Low Volatility and High Beta - Junk bonds are seriously underperforming Treasuries and high beta stocks are underperforming low volatility stocks.
Bonds, Gold, the PPO and Stretched Conditions - TLT and GLD are on a tear, but are stretched by one key metric and could be ripe for a correction in the coming weeks.
Choose a Strategy, Develop a Plan and Follow a Process
Arthur Hill, CMT
Chief Technical Strategist, TrendInvestorPro.com
Author, Define the Trend and Trade the Trend
Want to stay up to date with Arthur's latest market insights?
– Follow @ArthurHill on Twitter


