 Yesterday, I wrote about the Technology sector in my RRG Charts blog, where I discussed how the semiconductor stocks as a group showed relative strength against XLK. For this DITC article, I want to work off that subset of stocks in the technology space.
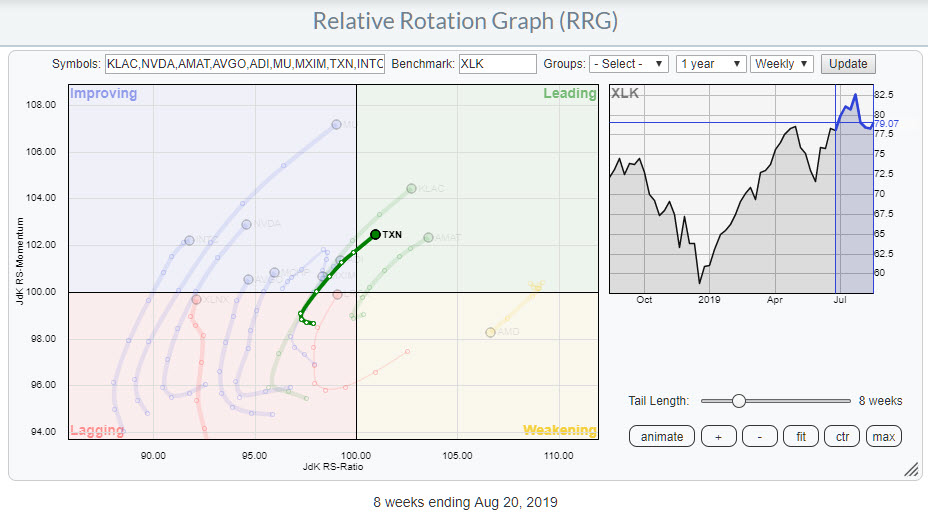
The Relative Rotation Graph above shows all semiconductor stocks in the Technology sector against the benchmark XLK. I have highlighted Texas Instruments (TXN) for further investigation.
The main reasons why I picked TXN over any of the others were:
- It has just entered the leading quadrant and is still at low JdK RS-Ratio and JdK RS-Momentum levels, meaning that there is plenty of upside available on both scales.
- It is traveling at a strong RRG-Heading, between 0-90 degrees with RRG-Velocity (the distance between the observations) increasing, indicating strength.
- On the daily RRG, TXN is inside weakening but starting to curl up, suggesting that a second leg of the relative uptrend is about to get underway.
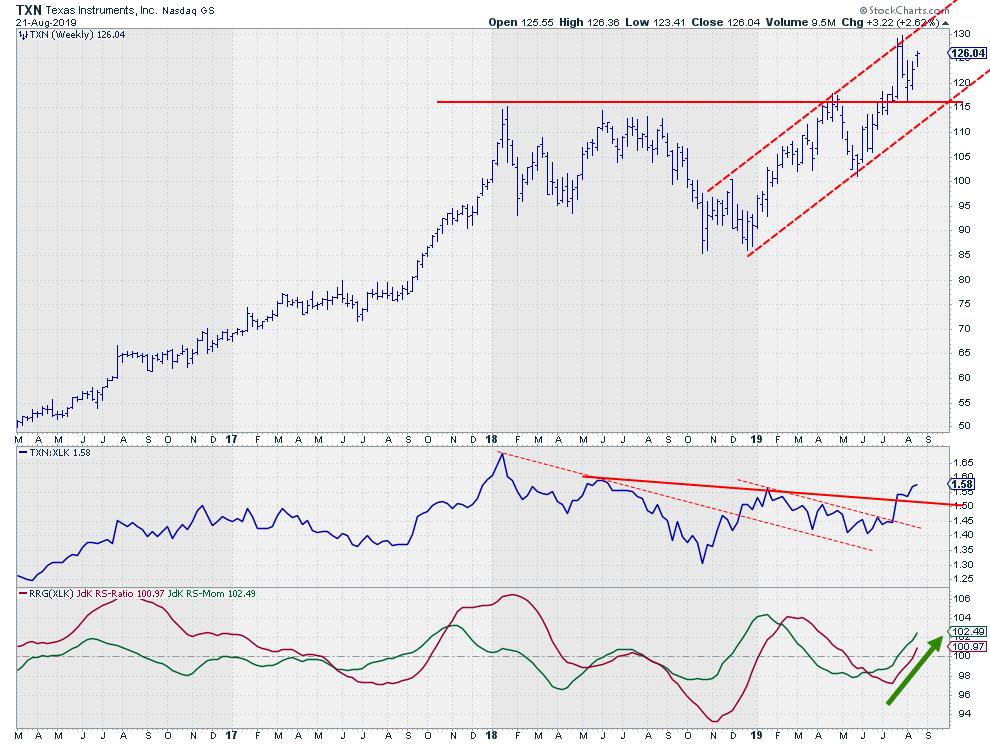
- The (weekly) price chart, in combination with relative strength, is showing breakouts above important resistance levels.

At the start of July, TXN broke above that important 18-month-old horizontal resistance level. In the first week of August, this level became even more meaningful when it was tested as support on the pullback. TXN remains inside the rising channel and seems to be on its way toward breaking above its recent high.
In relative strength, resistance is not as defined as in price, but we can see a few trend lines being broken, all in an upward direction. I have added a few trend lines that I think are important, but some of these are clearly more reliable than others. Lines with only two touchpoints remain very debatable. Nevertheless, the general direction for RS is to move higher.
In the RRG-Lines, the recent improvement for TXN is picked up first by RS-Momentum crossing above 100 first, followed shortly thereafter by RS-Ratio.
If you appreciate Technology, you will like Semiconductors - and you probably love TXN!
My regular blog is the RRG Charts blog. If you would like to receive a notification when a new article is published there, simply "Subscribe" with your email address.
Julius de Kempenaer
Senior Technical Analyst, StockCharts.com
Creator, Relative Rotation Graphs
Founder, RRG Research
Want to stay up to date with the latest market insights from Julius?
– Follow @RRGResearch on Twitter
– Like RRG Research on Facebook
– Follow RRG Research on LinkedIn
– Subscribe to the RRG Charts blog on StockCharts
Feedback, comments or questions are welcome at Juliusdk@stockcharts.com. I cannot promise to respond to each and every message, but I will certainly read them and, where reasonably possible, use the feedback and comments or answer questions.
To discuss RRG with me on S.C.A.N., tag me using the handle Julius_RRG.
RRG, Relative Rotation Graphs, JdK RS-Ratio, and JdK RS-Momentum are registered trademarks of RRG Research.
Julius de Kempenaer
Senior Technical Analyst, StockCharts.com
Creator, Relative Rotation Graphs
Founder, RRG Research
Host of: Sector Spotlight
Please find my handles for social media channels under the Bio below.
Feedback, comments or questions are welcome at Juliusdk@stockcharts.com. I cannot promise to respond to each and every message, but I will certainly read them and, where reasonably possible, use the feedback and comments or answer questions.
To discuss RRG with me on S.C.A.N., tag me using the handle Julius_RRG.
RRG, Relative Rotation Graphs, JdK RS-Ratio, and JdK RS-Momentum are registered trademarks of RRG Research.


