I have been very bullish on the markets recently and they have continued to perform pretty well until this week. With global markets breaking out to new highs, some promise in emerging markets and a rebound in the commodities, it has been a quick run up from the August lows. Now, with the OPEC meeting, the Federal Reserve meeting and the Options Expiration (OE) over, the markets are setting up for the 4th quarter earnings.
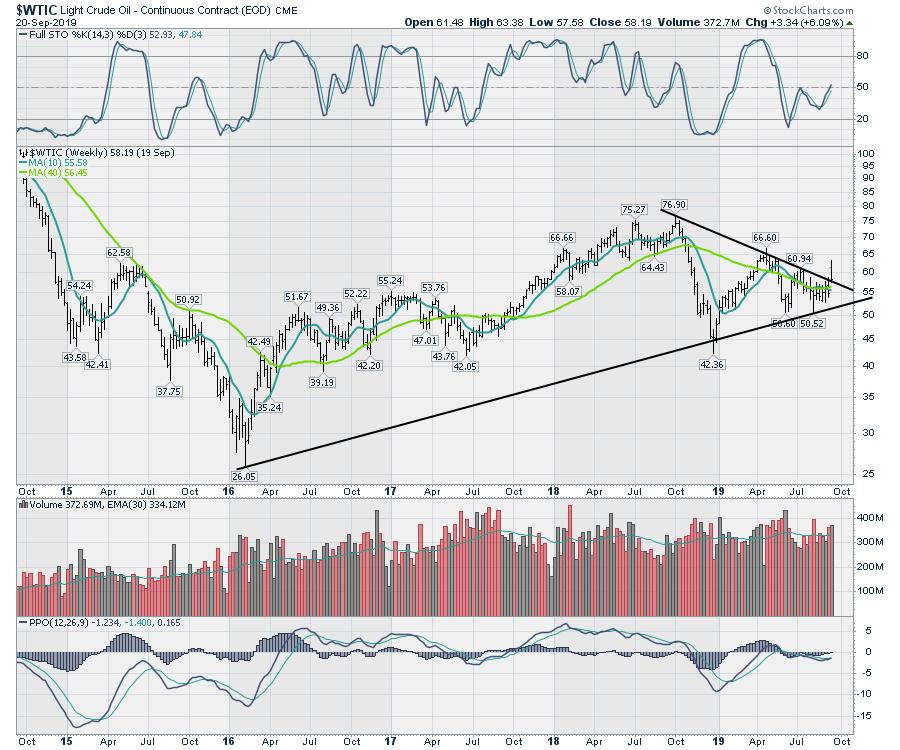
Quite frankly, I was very disappointed that the Chinese trade delegation left early on Friday afternoon, as it was one of the key pillars of what appeared to be happening in the markets. The Shanghai market had turned up on the weekly chart and commodity markets have been accelerating. Oil closed the week up 6%, but near the bottom of the range and right back at the trend line, which took away some of the bullish tone. Both the full stochastic and the PPO momentum indicator turned up, but we still have to see how the oil inventories are affected over the next few weeks from the attacks on the Saudi oilfields.
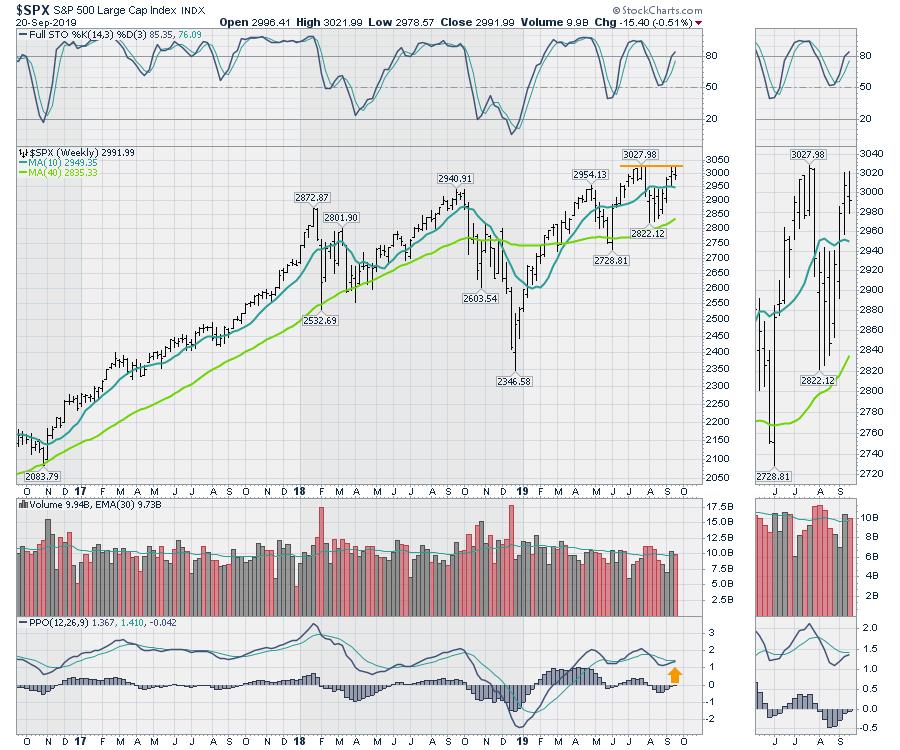
Technically, the market is in a very tender place in terms of momentum. While all of the indexes have turned the PPO momentum indicator up, the $SPX PPO indicator is currently in a position where it is making lower lows and similar highs in momentum. We like higher highs and higher lows in momentum, not lower lows in momentum.
This recent turn higher was very bullish but, as of Friday's close, the PPO has not crossed the signal line. Additionally, the price bar had a higher low and a slightly higher high this week, but we closed in the bottom half of the bar, putting the market's ability to break out into question. There were a lot of industries trending higher the week of September 9, so this sudden lull with the Fed and the OE is concerning.
A sudden thrust down next week would be extremely bearish.
What makes this market analysis more difficult currently are the noticeably wild waves on the PPO, which are literally flipping every month. While that might make the critics of technical analysis happy, looking left shows this to be the choppiest period in three years. Looking all the way back to 2012, there are other periods that are as difficult, but the amplitude of these waves are extra large in comparison.
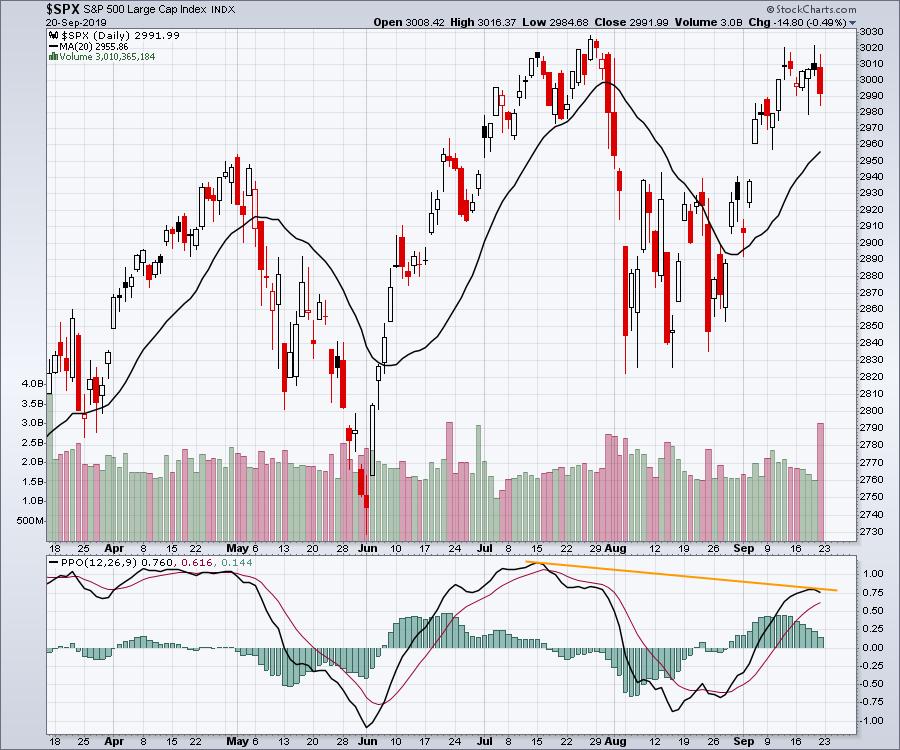
I will spend a lot more time discussing this over the weekend, and I would encourage you to view the upcoming Canadian Technician video for a lot more detailed discussion. I did cover some of this on the Market Buzz show Friday morning (the video is titled Oil After The Attack!). We always have to wait for the close on a weekly chart, but the weak finish on Friday gave us 4 out of 6 down closes on the daily chart below, including last Friday. All of those came after we tested the 3020 level last week; the price could not close at the 3020 level, despite trying again and again. The best we could do was to close near 3010. I have placed a yellow line on the PPO noting some divergence, but we don't have a top on the current wave until it crosses the signal line.
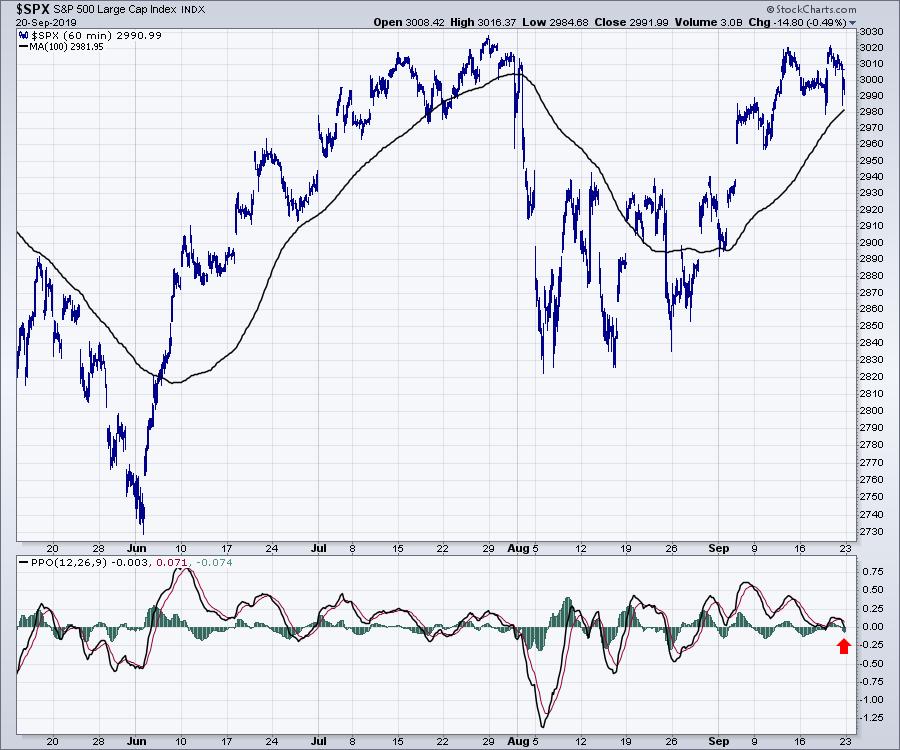
To get even more granular, the hourly chart is starting to fail. While the 1-hour chart is not my go-to chart, we can see how the momentum this week has collapsed by looking at the PPO, which closed in negative territory for the week. The last time that happened was August; we can see the same "weak" PPO momentum at the late July top.
Heads up - I might have to become a bear again. Lots more on this weekend's Canadian Technician video. You can find it near the bottom of the StockCharts YouTube page.
Good trading,
Greg Schnell, CMT, MFTA
Senior Technical Analyst, StockCharts.com
Author, Stock Charts For Dummies
Want to stay on top of the market's latest intermarket signals?
– Follow @SchnellInvestor on Twitter
– Connect with Greg on LinkedIn
– Subscribe to The Canadian Technician
– Email at info@gregschnell.com


