For a while now, Zimmer Biomed (ZBH) has simmered sideways as it range-traded for years. Over the last few months, however, the chart has taken on an improving status and is now following the healthcare surge to new highs. What makes the chart more interesting for me is the improving status relative to its large-cap peers. Can it keep that up?
Two different indicators are starting to show improvement. First of all, the SCTR bounced at 50, rather than below 30, and has now returned to the top quartile area above 75. That is a positive sign, as we want to see the stock continue to outperform its peers consistently.
On the $SPX relative strength chart, the stock is breaking out to new 2-year highs in RS. That is very bullish and, if the RS line can continue to move higher as the stock breaks out of a big base, that would be icing on a nice chart.
As you can see in the top right corner, the stock price is banging on the chart ceiling! That is what winners do. Just because the chart ends there doesn't mean the stock can't move higher. There is no resistance from sellers, as the stock is at its highest level in 5 years. The chart scale will expand as price moves up.
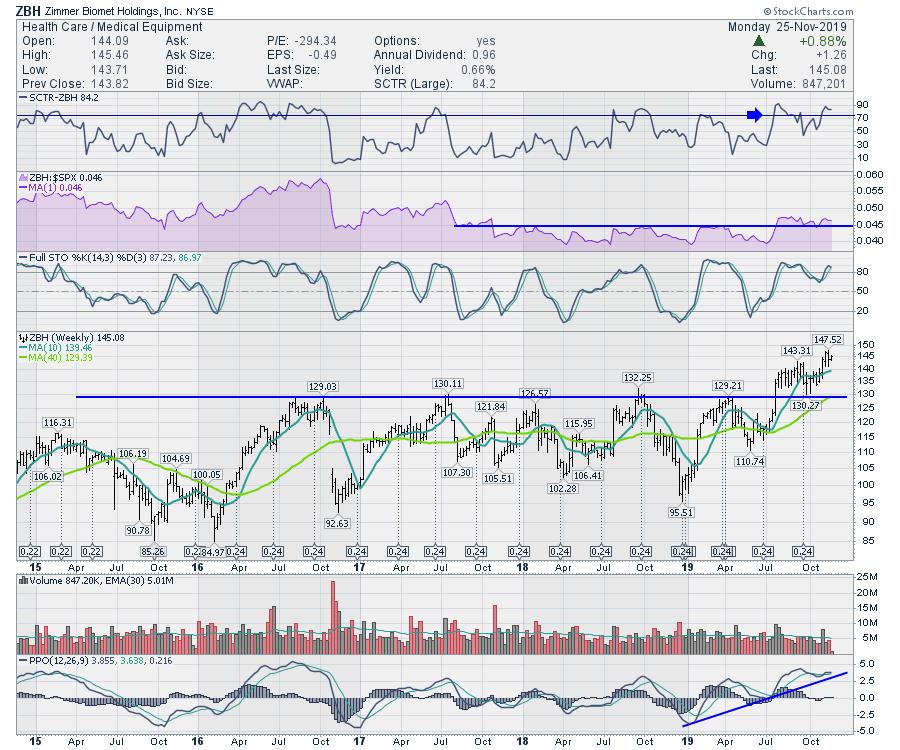
Investors will have to match their entry with the chart. Breakout buyers are starting to see gains; buyers looking for a pullback might get a chance as the PPO is extended. If the stock is going to stay in a firm uptrend, the PPO should stay above zero, so adding this to a list of pullback names could also work. Healthcare breaking out in November also adds to the attractiveness of the stock.
Almost all of the content creators at StockCharts have been able to organize their calendars to host an online conference called Vision 2020. If you are interested in learning more about the Market Vision 2020 conference to kick off the next decade, follow this link immediately for more information! I am sure if we called it 20/20 Vision, that might be too aggressive, but it should be a wonderful kickoff to the next decade!
Check out the information by following the link!
Good trading,
Greg Schnell, CMT, MFTA
Senior Technical Analyst, StockCharts.com
Author, Stock Charts For Dummies
Want to stay on top of the market's latest intermarket signals?
– Follow @SchnellInvestor on Twitter
– Connect with Greg on LinkedIn
– Subscribe to The Canadian Technician
– Email at info@gregschnell.com


