Don't Ignore This Chart! February 22, 2023 at 07:04 PM
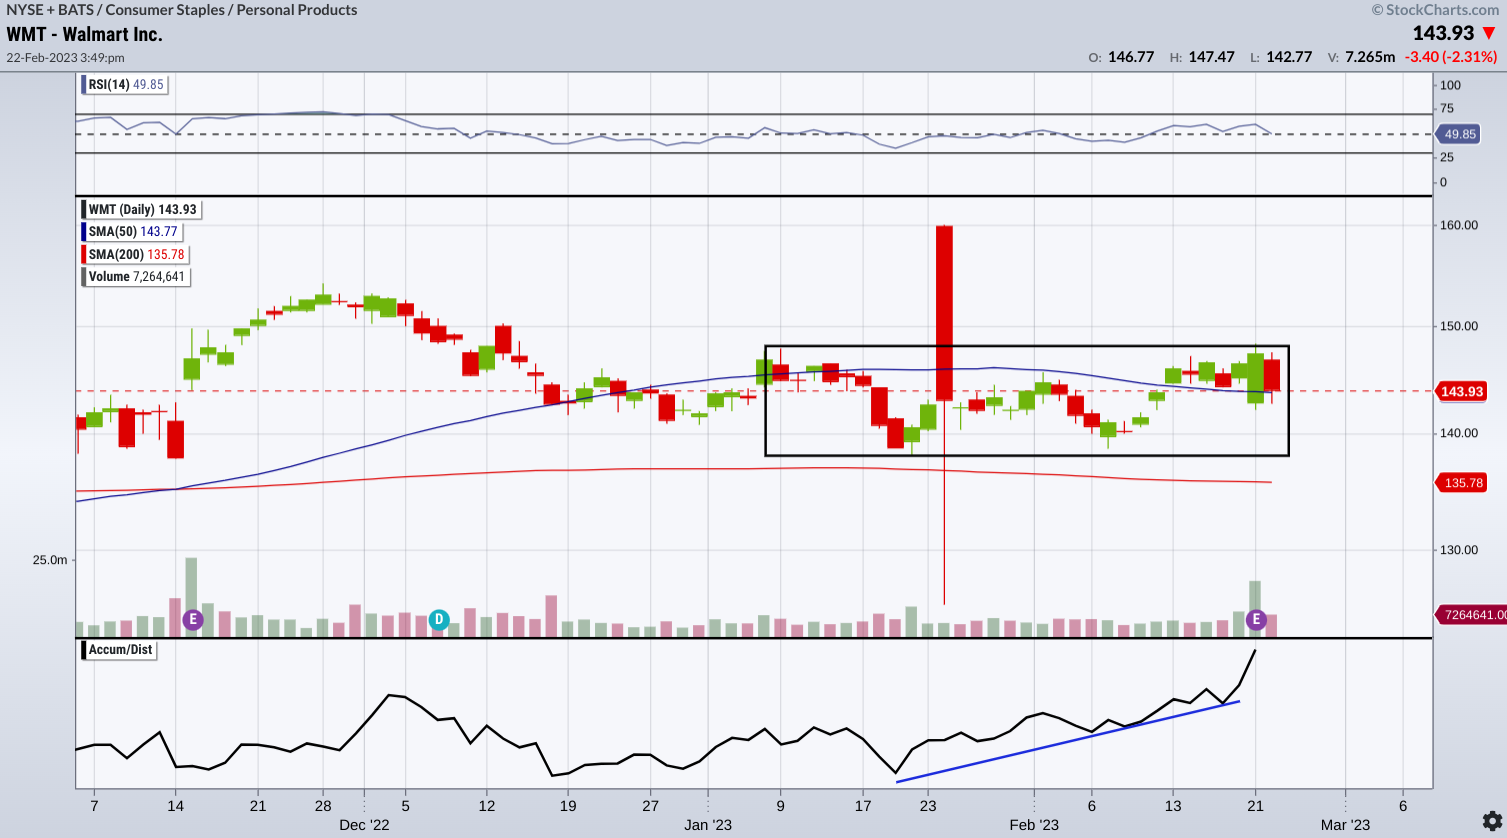
Walmart's (WMT) stock price jumped slightly over half a percent last Tuesday upon releasing its Q4 2022 earnings report. The retailer topped Wall Street's earnings and revenue estimates... Read More
Don't Ignore This Chart! February 17, 2023 at 09:39 AM

Roblox (RBLX) may still be considered by some on Wall Street as a relative "noob," but the company's plans and ambitions are catching the attention of investors as its most recent Q4 22 earnings and guidance laid out a much clearer picture of its perceived arena... Read More
Don't Ignore This Chart! February 15, 2023 at 07:47 PM
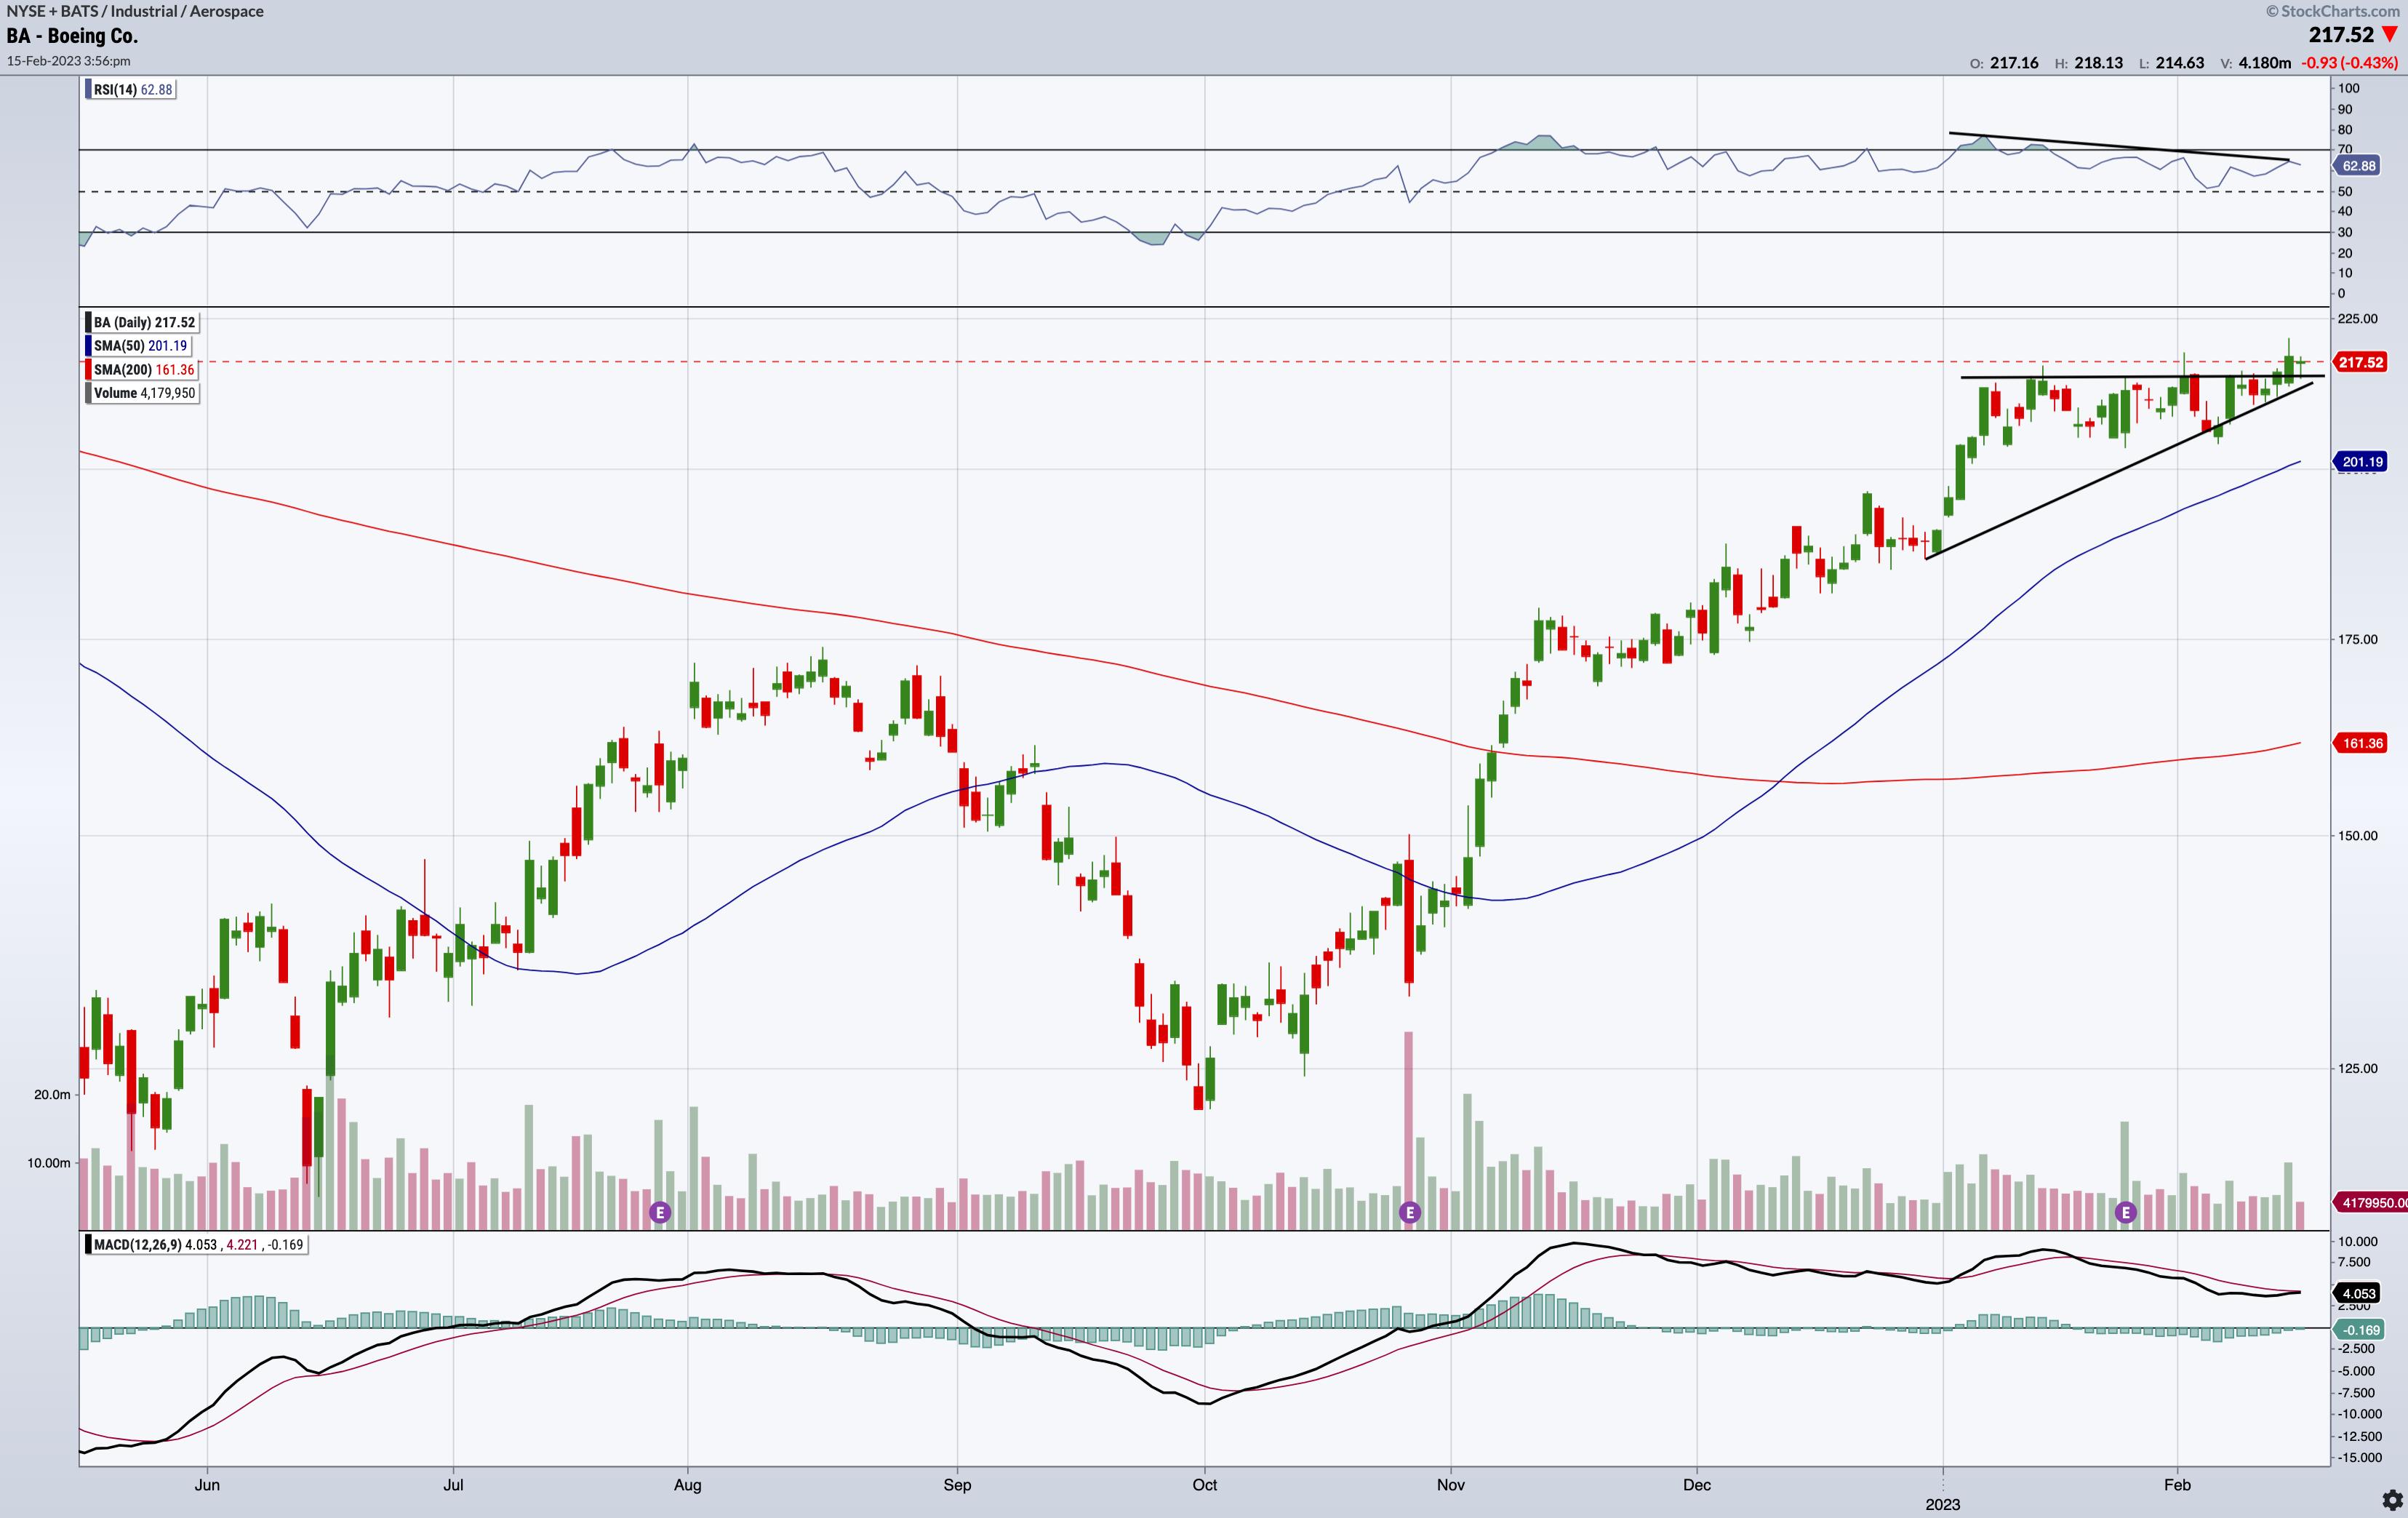
When traders and investors brave the heights of speculative endeavor, clear conditions, fundamentally and technically, are the most you could ask for. But there are cases where fundamentals remain foggy and technical chart patterns seem almost hidden or questionable... Read More
Don't Ignore This Chart! February 12, 2023 at 10:50 AM
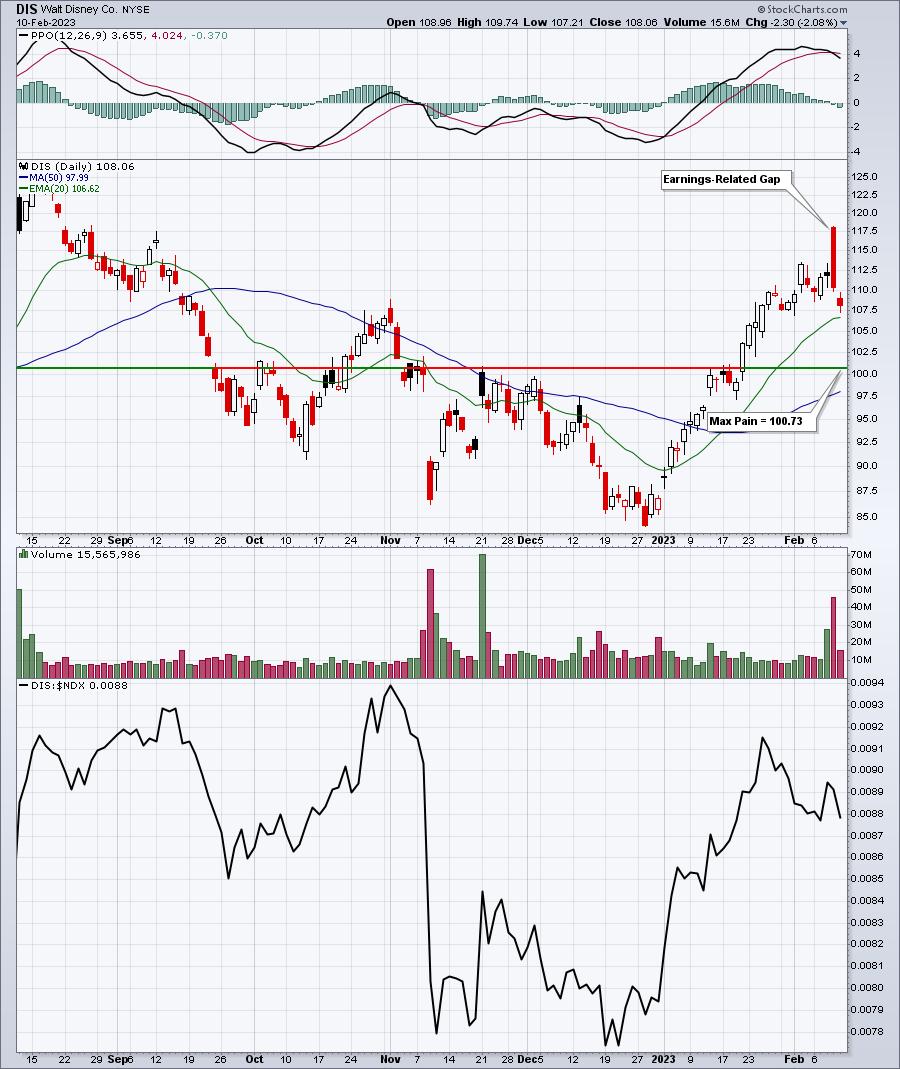
Monthly options expiration creates a whole new set of headaches for retail traders... Read More
Don't Ignore This Chart! February 07, 2023 at 07:54 PM

Shutterstock (SSTK), the American creative content solutions firm, has been riding a doozy of a downtrend from October 2021 to the end of 2022. Aside from the bear mauling, SSTK's fundamentals weren't entirely disappointing... Read More
Don't Ignore This Chart! February 06, 2023 at 07:14 PM
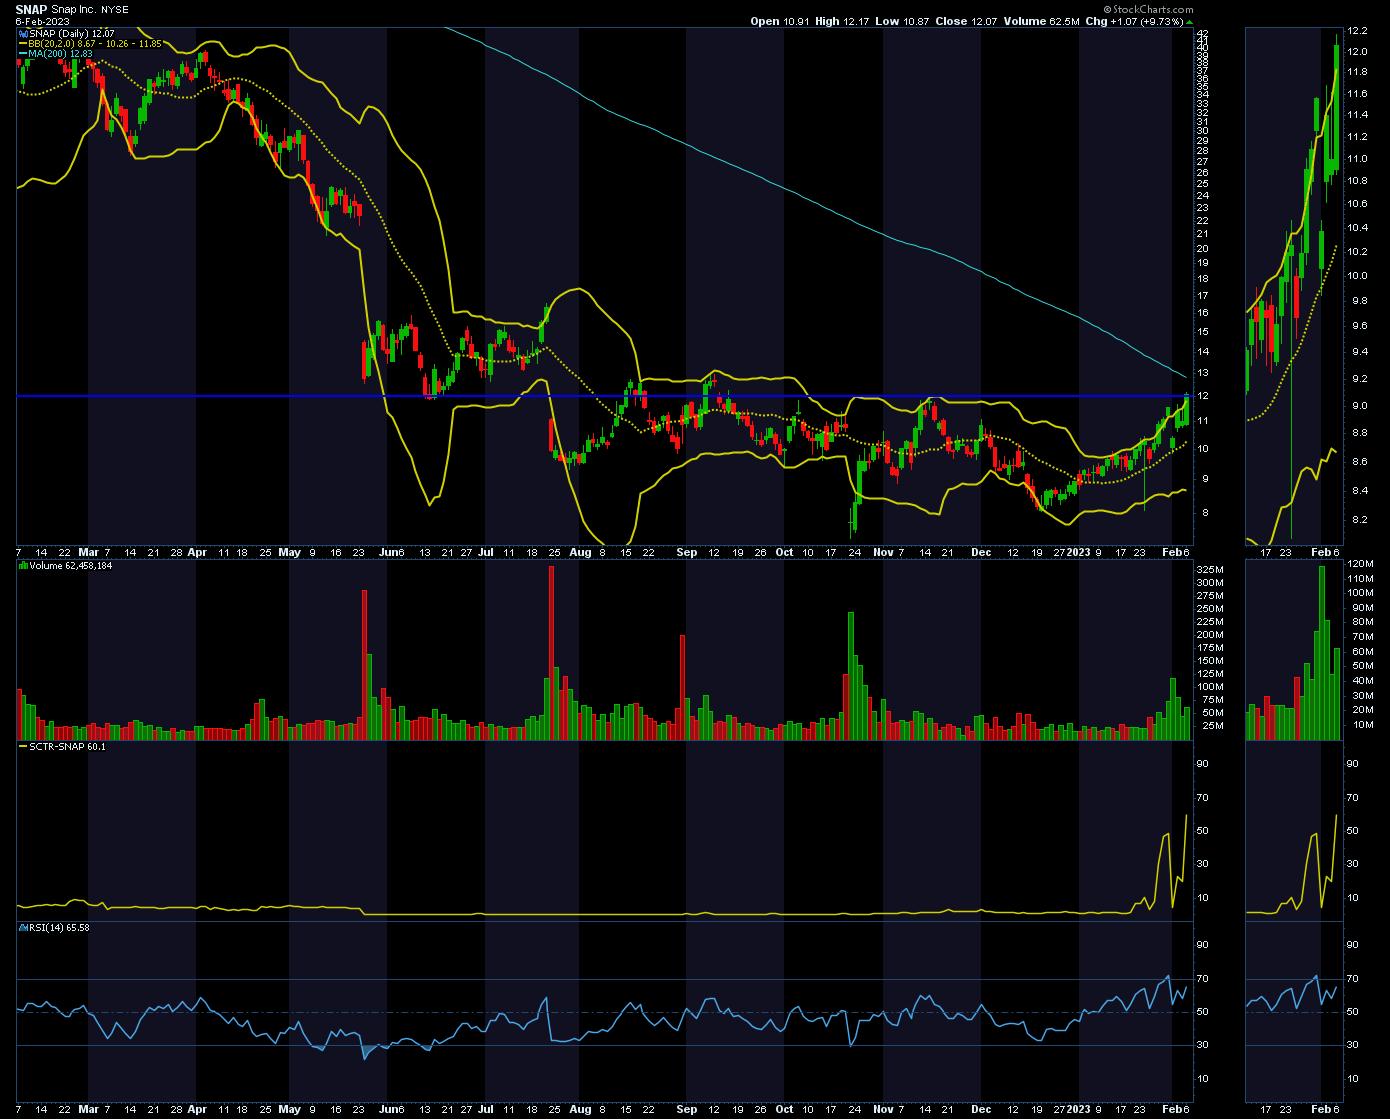
SNAP's got a new game plan up its sleeve and, depending on how well it fits, it may make or break the stock. After flat or disappointing earnings reports for most of 2022, mainly due to weak social media ad revenues, SNAP stock has suffered... Read More
Don't Ignore This Chart! February 02, 2023 at 05:26 AM
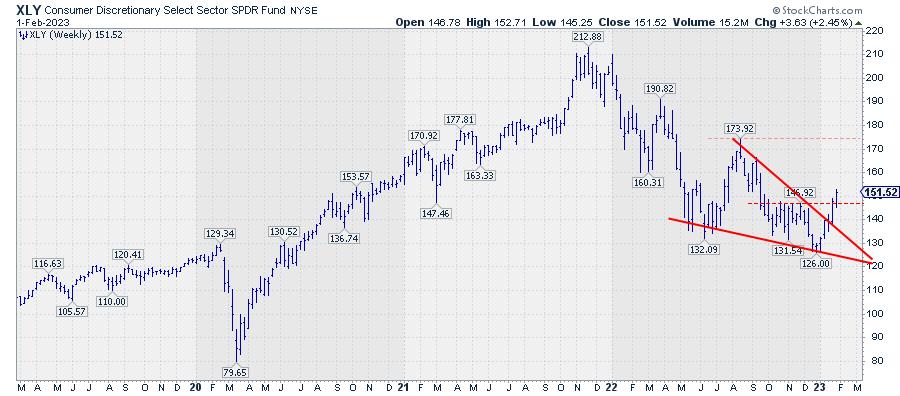
In the second half of 2022, the price chart for XLY started to form a falling wedge pattern. This pattern or formation is characterized by two converging trendlines, BOTH moving lower. The falling wedge variant comes in two variations... Read More