MailBag July 31, 2009 at 04:25 PM

Point & Figure Charts (PnF) can be scaled using traditional box scaling, percentage box scaling, user-defined scaling or Average True Range (ATR) scaling. Scaling refers to the box size. Traditional scaling is based on price levels. In other words, the size of the box increases with the price of the stock. Stocks priced from 5.01 to 20.00 scale at 50 cents per box. Stocks priced from 20.01 to 100 scale at 1 dollar per box. Yes, the scale adjusts as the price changes. Below is a traditional PnF chart for Amdocs (DOX) showing the scale adjusting as price changes. Read More
MailBag July 24, 2009 at 02:08 PM

RSI settings depend on your analysis objectives. The default setting for RSI is 14 periods. However, when looking for short-term overbought/oversold readings, I like to use a shorter look-back period. Often, this is 10 days, which covers two weeks. When looking to capture general trend, a longer look-back period works better because it is less choppy. The sensitivity of a momentum oscillator depends on the number of look-back periods. 10-period RSI will be more sensitive than 20-period RSI. This means 10-period RSI will produce more overbought (>70) and oversold readings (<30) Read More
MailBag July 17, 2009 at 03:00 PM

Yes, I can recommend two books for some relatively light summer readings. Reminiscences Of A Stock Operator, by Edwin LeFevre, is at the top of the list. First published in 1923, this book is a classic that you will want to read over and over again. My copy is full of highlights and remarks. Jesse Livermoore, the central character, started speculating in bucket shops on the East Coast and worked his way up to Wall Street. Trading in the trenches, Livermore learned first hand what works and what doesn’t work. In fact, many of his observations have become standard trading maxims. For Read More
MailBag July 10, 2009 at 02:57 PM
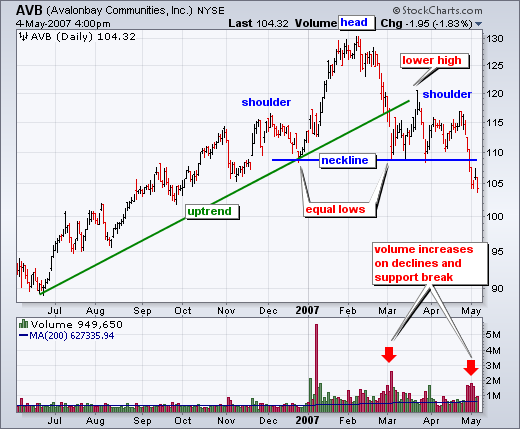
The classic head-and-shoulders is a bearish reversal pattern that marks a top. There are also inverse head-and-shoulders patterns and continuation head-and-shoulders patterns, but this article will simply focus on the bearish reversal version. As a bearish reversal pattern, an uptrend or extended advance is a prerequisite. You cannot reverse an uptrend if there is no uptrend to start with! There are four components to the head-and-shoulders pattern: the left shoulder, the head, the right shoulder and the neckline. The uptrend is in full swing as the left shoulder and head form (higher Read More
MailBag July 03, 2009 at 01:45 PM
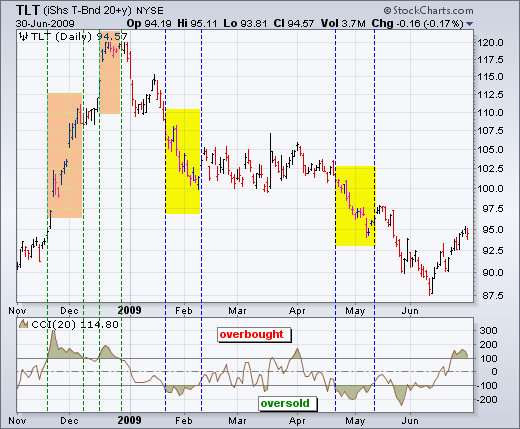
Momentum oscillators can move to extremes and remain at extremes during strong trends. In a strong uptrend, a momentum oscillator can become overbought and remain overbought. This is when momentum is overbought, but still bullish. In a strong downtrend, a momentum oscillator can become oversold and remain oversold. This is when momentum is oversold, but still bearish. It may sound like an oxymoron, but a chart example should help clear up this point. The accompanying chart shows the 20+ Year Treasury ETF (TLT) with the Commodity Channel Index (CCI). This momentum oscillator is considered Read More