MailBag June 26, 2009 at 02:06 PM
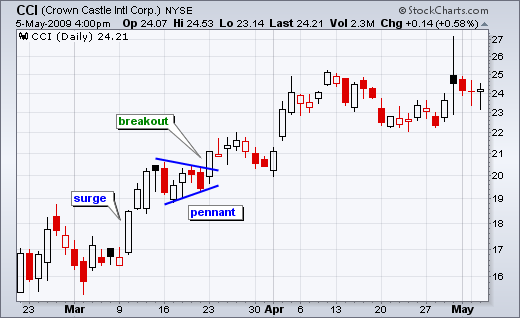
Triangles and pennants look the same, but their timeframes and expectations are different. Pennants are short-term patterns that form after a steep advance or sharp decline. Pennants typically extend 1-3 weeks, after which a continuation of the prior move is expected. Anything longer is probably a triangle. Triangles are medium-term or long-term patterns that form independent of the prior move. There are no directional expectations. It depends on the direction of the trendline break. The first chart shows Crown Castle (CCI) with a bullish pennant in March 2009. Notice that the stock Read More
MailBag June 19, 2009 at 02:52 PM
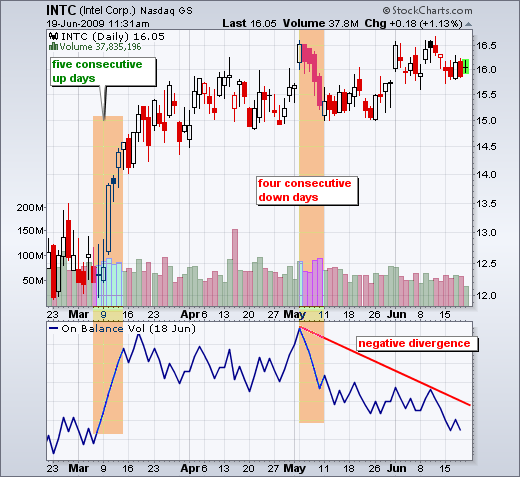
On Balance Volume (OBV) and the Accumulation Distribution Line are both volume-based indicators that are cumulative. Periodic values are added or subtracted to form a chart (time series plot) that can be compared to the underlying security. The difference between these two indicators is based on the relative close. OBV compares the close with the prior close, while the Accumulation Distribution Line compares the close with the high-low range. Developed by Joe Granville, OBV is based on a relatively simple calculation. Volume is added when the stock closes above its prior close Read More
MailBag June 12, 2009 at 05:09 PM
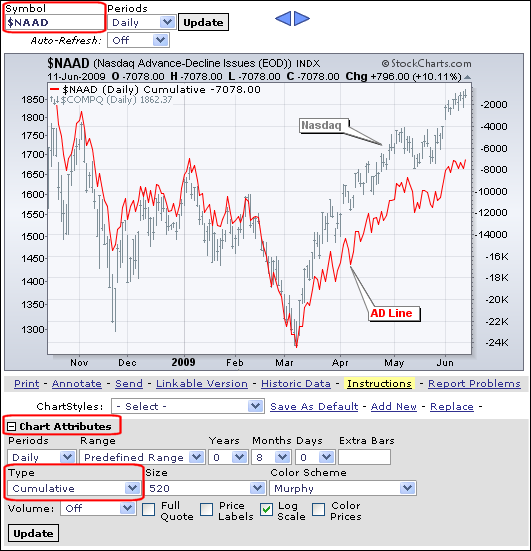
There are two steps to creating the AD Line. First, you need to know the symbol for net advances, which equals the number of advancing stocks less the number of declining stocks. $NAAD is the symbol for Nasdaq Net Advances and $NYAD is the symbol for NYSE Net Advances. Second, you need to select “Cumulative” as the chart “Type”. Under “Chart Attributes”, there is a drop-down menu for “Type”. This allows users to choose bars, candlesticks, line, area, cumulative and many other different plotting techniques. The chart below shows the AD Line for the Nasdaq. Red rectangles show the key Read More
MailBag June 05, 2009 at 01:48 PM
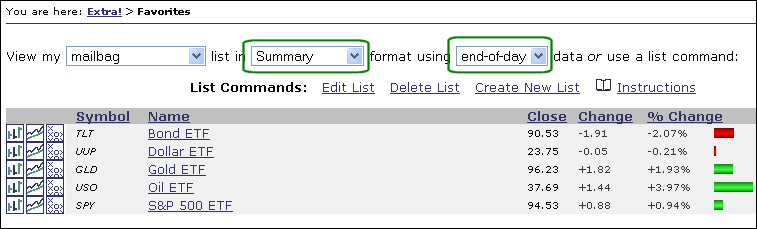
Q: What is your daily analysis routine? A: My daily analysis routine involves a top-down approach. First, I check the intermarket charts to see what’s happening with the S&P 500 (SPY), bonds (TLT), gold (GLD), oil (USO) and the Dollar (UUP). With a wide array of ETFs available, I can follow almost anything in real time through Stockcharts.com. In fact, I am continuously checking my custom market summary page throughout the day. Sharpcharts subscribers can view a market summary page based on your favorites lists by selecting “summary” for the format (see green box below). The image Read More