|
|
Most candlestick patterns form over 1-3 days, which makes them short-term patterns that are valid for 1-2 weeks. Hammers and shooting stars require just one day. Engulfing patterns, piercing patterns and dark cloud cover patterns require two days. Morning stars and evening stars require three days.
Keep in mind that these candlestick patterns are trying to reverse an existing trend, usually a short-term trend that is a few weeks old. Bullish candlestick patterns form in short-term downtrends, while bearish candlestick patterns form in short-term uptrends. Do not expect a long-term trend reversal from a candlestick pattern. More likely, a candlestick pattern may establish support/resistance or signal the start of a pullback or bounce.

Click on this chart to see more details.
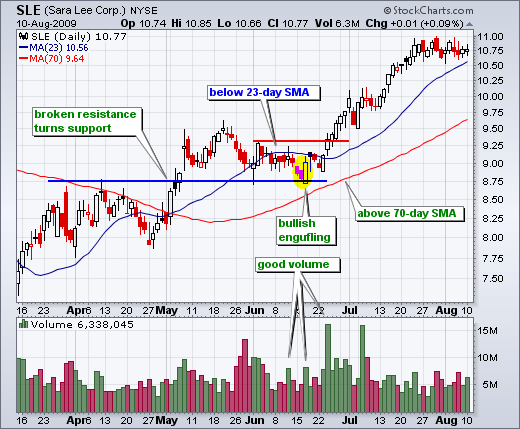
Traders may want to combine tactics to improve candlestick signals. For example, look for bullish candlestick patterns when the medium-term trend is up and the short-term trend is down (i.e. a short-term pullback in a medium-term uptrend). The chart above shows Sara Lee (SLE) with the 70-day SMA (3 months) and 23-day SMA (1 month). SLE was trading above the 70-day SMA for a medium-term uptrend, but below the 23-day SMA for a short-term downtrend. SLE then formed a high-volume bullish engulfing that established a tradable low. A high-volume follow through breakout occurred a few days later.
You can read more on candlesticks in the Chart School.


Posted by: Teresa Connolly August 28, 2009 at 16:18 PM