|
|
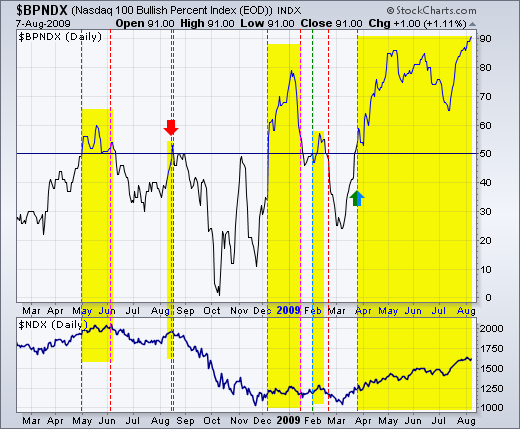
Bullish percent is a breadth indicator that shows the percentage of stocks in a given index with Point&Figure buy signals. If 60 of the 100 stocks in the Nasdaq 100 are on Point&Figure buy signals, then the bullish percent would be 60% (60/100 = .60 or 60%). Readings above 50% show general strength, while readings below 50% show general weakness. Because bullish percent oscillates above and below the 50% line, traders can also look for overbought/oversold conditions as well as positive/negative divergences.

Click on this chart to see more details.
The chart below shows Nasdaq 100 Bullish% ($BPNDX) over the last 18 months. Bullish% was above 50% in the yellow areas and below 50% otherwise. As with all indicators, the signals are not perfect and there are whipsaws. However, there is clearly a correlation between NDX strength and bullish%. The most recent cross above 50% occurred in early March (green arrow) and has been in effect for four months. There was also a good bearish signal in mid August (red arrow). If fact, these two signals more than made up for the other whipsaws.
A large positive divergence foreshadowed the March low. Bullish% bottomed in October and formed higher lows in November and again in March. Even though the Nasdaq 100 tested its November low in March, the bullish% indicator held well above its November low as 25% of stocks remained on Point&Figure buy signals.
Stockcharts.com provides the Bullish Percent Indicator for the following indices:
$BPNYA NYSE
$BPCOMPQ Nasdaq
$BPOEX S&P 100
$BPNDX Nasdaq 100
$BPSPX S&P 500
$BPINDU Dow 30
$BPDISC Consumer Discretionary
$BPSTAP Consumer Staples
$BPENER Energy
$BPFINA Finance
$BPHEAL Healthcare
$BPINFO Info Tech
$BPINDY Industrial
$BPMATE Materials
$BPTELE Telecom
$BPUTIL Utilities


