|
|
Stocks forming
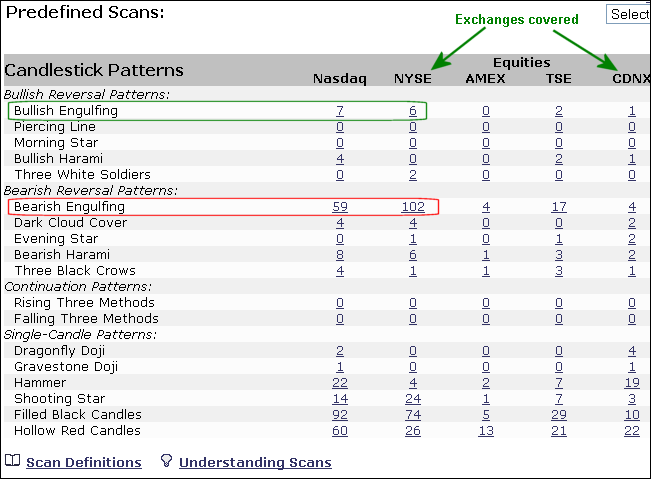
candlestick patterns can be found on the Predefined Scans page. Over 10 candlestick patterns are scanned every day. The image below shows a snapshot of the candlestick scan page for January 21st. After the sharp decline on the 21st, notice that a number of bearish engulfing patterns formed within the Nasdaq (59) and the NYSE (102). Despite such weakness, there were even a few bullish engulfing patterns registered on the major exchanges. In addition to the NYSE and Nasdaq, users can also see scan retults for the Amex, Toronto Stock Exchange (TSE) and Canadian Venture Exchange (CDNX).
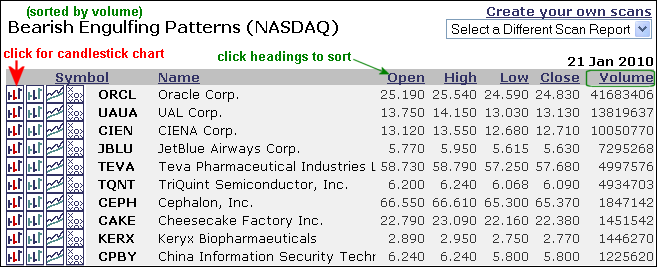
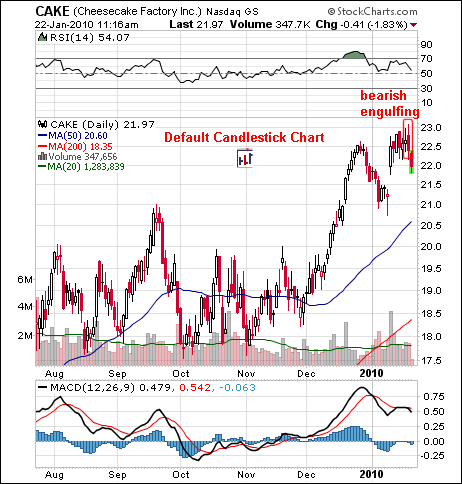
 Click on the numbers under the exchange to show a list of these stocks. The table below shows stocks with Bearish Engulfing patterns in the Nasdaq. This list can be sorted by clicking on the headings (open, high, low, close, volume). This list is sorted by volume to show stocks with the highest volume at the top. The icons to the left of the stock symbol can be clicked to show the charts. The icon on the far left shows the default candlestick chart, the icon second from the left shows the default chart for SharpCharts users, the third shows a gallery view and the fourth shows a Point & Figure chart. This makes it easy to view numerous charts featuring your
favorite candlestick scan.
.


