|
|
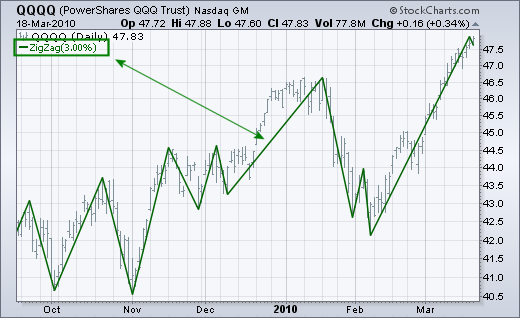
First, let’s start with a basic Zigag. The Zigzag indicator is a hindsight indicator that identifies moves of a certain percentage. For example, a Zigzag (3) would only show movements that were 3% or more. The first chart shows the Nasdaq 100 ETF (QQQQ) with Zigzag (3). There are 12 moves of at least 3% from mid September to mid March. Notice that the Zigzag line turned down the last two days. This is not because QQQQ declined 3% or more. Rather, the last line is always drawn from the most recent peak/trough the current low/high.

If 3% swings are too small, the parameters can be increased to filter out smaller swings. The second chart shows QQQQ with a 5% Zigzag. Instead of 12 moves, there are now just 6 moves of 5% or more. Higher parameters will decrease the number of zigzags. This indicator is good for filtering out noise and focusing only on specific moves. It can also be helpful for Elliott wave counts.

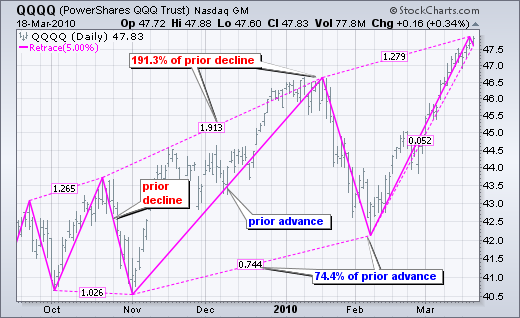
The Zigzag with Retracements indicator adds another dimension. The dotted lines show the percentage retracement of the prior move. The decline to the early November low represents one prior move (red). The subsequent advance to the January high was 191.3% of that prior decline, which is almost double. The subsequent decline to the February low retraced 74.4% of the prior advance. This number can be helpful when making Fibonacci based projections.


If 3% swings are too small, the parameters can be increased to filter out smaller swings. The second chart shows QQQQ with a 5% Zigzag. Instead of 12 moves, there are now just 6 moves of 5% or more. Higher parameters will decrease the number of zigzags. This indicator is good for filtering out noise and focusing only on specific moves. It can also be helpful for Elliott wave counts.

The Zigzag with Retracements indicator adds another dimension. The dotted lines show the percentage retracement of the prior move. The decline to the early November low represents one prior move (red). The subsequent advance to the January high was 191.3% of that prior decline, which is almost double. The subsequent decline to the February low retraced 74.4% of the prior advance. This number can be helpful when making Fibonacci based projections.


