|
|
Developed by George C. Lane in the late 1950s, the Stochastic Oscillator is a momentum indicator that reflects the location of the close relative to the high/low range over a set number of periods. The location of the close is found by subtracting it from the low for that period. Here is a calculation example.
10-period high = 50
10-period low = 40
Last Price = 48
Close location = 48 - 40 = 8
High-Low range - 50 - 40 = 10
Stochastic Oscillator = 8/10 = .80
This is the calculation for the %K component of the Stochastic Oscillator (black line). Lane multiplied this by 100 to get a round number so .80 becomes 80. The Stochastic Oscillator, and %K, fluctuate between 0 and 100.
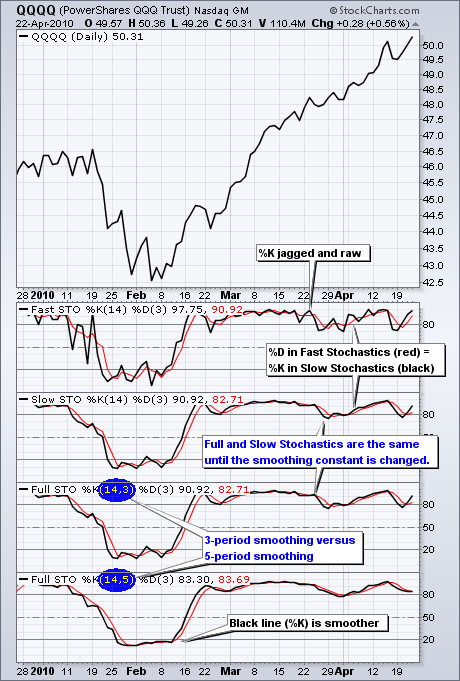
The chart below shows the Nasdaq 100 ETF (QQQQ) with Fast, Slow and Full Stochastics. Fast Stochastics (14,3) is based on the raw %K (black line) as calculated above, which produces a jagged line. The first number (14) refers to the calculation period. The red line is %D, which is a 3-day SMA of the black line. The 3 in (14,3) refers to the calculation period for this moving average. It is used as a trigger line to highlight turning points.
 Click this image for details

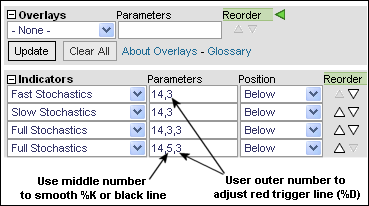
We need to use Full Stochastics (14,3,3) to adjust the smoothing in %K. 14 refers to the calculation period. The first 3 refers to the smoothing periods for %K. The second 3 refers to the moving average periods for %D (the red line). In the example above, I changed the smoothing constant to 5 in the bottom indicator window and this further smoothed the black line (%K).
10-period high = 50
10-period low = 40
Last Price = 48
Close location = 48 - 40 = 8
High-Low range - 50 - 40 = 10
Stochastic Oscillator = 8/10 = .80
This is the calculation for the %K component of the Stochastic Oscillator (black line). Lane multiplied this by 100 to get a round number so .80 becomes 80. The Stochastic Oscillator, and %K, fluctuate between 0 and 100.
The chart below shows the Nasdaq 100 ETF (QQQQ) with Fast, Slow and Full Stochastics. Fast Stochastics (14,3) is based on the raw %K (black line) as calculated above, which produces a jagged line. The first number (14) refers to the calculation period. The red line is %D, which is a 3-day SMA of the black line. The 3 in (14,3) refers to the calculation period for this moving average. It is used as a trigger line to highlight turning points.
 Click this image for details
Slow Stochastics (14,3) incorporates a 3-day SMA into %K for smoothing purposes. Notice that this black line (%K) for Slow Stochastics is smoother than the black line for Fast Stochastics. The 3 in Slow Stochastics (14,3) sets the periods for the red trigger line or moving average. It does not affect the smoothing of %K.

We need to use Full Stochastics (14,3,3) to adjust the smoothing in %K. 14 refers to the calculation period. The first 3 refers to the smoothing periods for %K. The second 3 refers to the moving average periods for %D (the red line). In the example above, I changed the smoothing constant to 5 in the bottom indicator window and this further smoothed the black line (%K).


